Don't Sell Krones AG (ETR:KRN) Before You Read This

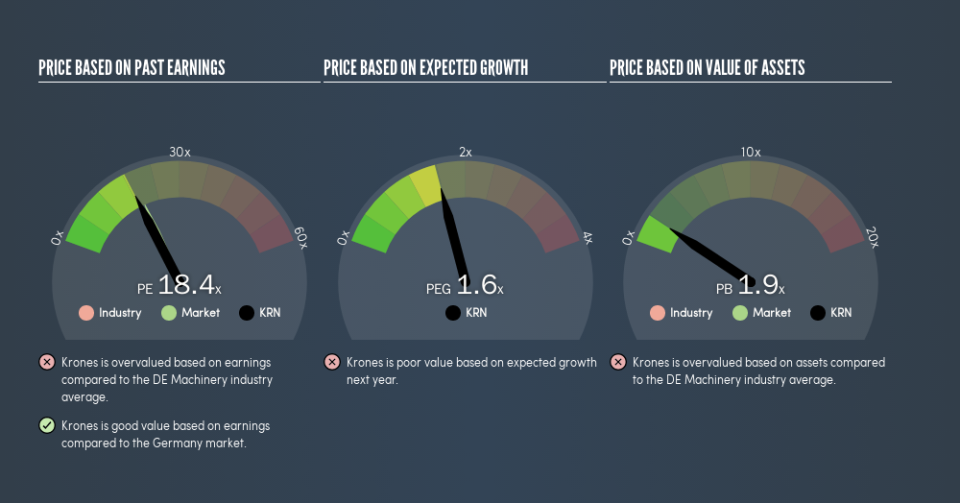
The goal of this article is to teach you how to use price to earnings ratios (P/E ratios). We'll show how you can use Krones AG's (ETR:KRN) P/E ratio to inform your assessment of the investment opportunity. Krones has a price to earnings ratio of 18.4, based on the last twelve months. In other words, at today's prices, investors are paying €18.4 for every €1 in prior year profit.
See our latest analysis for Krones
How Do I Calculate A Price To Earnings Ratio?
The formula for price to earnings is:
Price to Earnings Ratio = Price per Share ÷ Earnings per Share (EPS)
Or for Krones:
P/E of 18.4 = €88 ÷ €4.78 (Based on the year to December 2018.)
Is A High Price-to-Earnings Ratio Good?
The higher the P/E ratio, the higher the price tag of a business, relative to its trailing earnings. That isn't a good or a bad thing on its own, but a high P/E means that buyers have a higher opinion of the business's prospects, relative to stocks with a lower P/E.
How Growth Rates Impact P/E Ratios
When earnings fall, the 'E' decreases, over time. That means unless the share price falls, the P/E will increase in a few years. Then, a higher P/E might scare off shareholders, pushing the share price down.
Krones shrunk earnings per share by 20% over the last year. But over the longer term (5 years) earnings per share have increased by 4.5%. And EPS is down 1.4% a year, over the last 3 years. This might lead to low expectations.
How Does Krones's P/E Ratio Compare To Its Peers?
The P/E ratio indicates whether the market has higher or lower expectations of a company. As you can see below Krones has a P/E ratio that is fairly close for the average for the machinery industry, which is 18.4.
That indicates that the market expects Krones will perform roughly in line with other companies in its industry. If the company has better than average prospects, then the market might be underestimating it. Checking factors such as the tenure of the board and management could help you form your own view on if that will happen.
A Limitation: P/E Ratios Ignore Debt and Cash In The Bank
It's important to note that the P/E ratio considers the market capitalization, not the enterprise value. In other words, it does not consider any debt or cash that the company may have on the balance sheet. In theory, a company can lower its future P/E ratio by using cash or debt to invest in growth.
Spending on growth might be good or bad a few years later, but the point is that the P/E ratio does not account for the option (or lack thereof).
So What Does Krones's Balance Sheet Tell Us?
The extra options and safety that comes with Krones's €215m net cash position means that it deserves a higher P/E than it would if it had a lot of net debt.
The Verdict On Krones's P/E Ratio
Krones's P/E is 18.4 which is about average (19.6) in the DE market. Although the recent drop in earnings per share would keep the market cautious, the healthy balance sheet means the company retains potential for future growth. So it's not surprising to see it trade on a P/E roughly in line with the market.
When the market is wrong about a stock, it gives savvy investors an opportunity. As value investor Benjamin Graham famously said, 'In the short run, the market is a voting machine but in the long run, it is a weighing machine.' So this free visualization of the analyst consensus on future earnings could help you make the right decision about whether to buy, sell, or hold.
Of course, you might find a fantastic investment by looking at a few good candidates. So take a peek at this free list of companies with modest (or no) debt, trading on a P/E below 20.
We aim to bring you long-term focused research analysis driven by fundamental data. Note that our analysis may not factor in the latest price-sensitive company announcements or qualitative material.
If you spot an error that warrants correction, please contact the editor at editorial-team@simplywallst.com. This article by Simply Wall St is general in nature. It does not constitute a recommendation to buy or sell any stock, and does not take account of your objectives, or your financial situation. Simply Wall St has no position in the stocks mentioned. Thank you for reading.
