Don't Sell MásMóvil Ibercom, S.A. (BME:MAS) Before You Read This

Today, we'll introduce the concept of the P/E ratio for those who are learning about investing. We'll apply a basic P/E ratio analysis to MásMóvil Ibercom, S.A.'s (BME:MAS), to help you decide if the stock is worth further research. MásMóvil Ibercom has a price to earnings ratio of 20.70, based on the last twelve months. In other words, at today's prices, investors are paying €20.70 for every €1 in prior year profit.
See our latest analysis for MásMóvil Ibercom
How Do You Calculate A P/E Ratio?
The formula for P/E is:
Price to Earnings Ratio = Price per Share ÷ Earnings per Share (EPS)
Or for MásMóvil Ibercom:
P/E of 20.70 = €15.070 ÷ €0.728 (Based on the trailing twelve months to December 2019.)
(Note: the above calculation results may not be precise due to rounding.)
Is A High Price-to-Earnings Ratio Good?
A higher P/E ratio means that buyers have to pay a higher price for each €1 the company has earned over the last year. That is not a good or a bad thing per se, but a high P/E does imply buyers are optimistic about the future.
How Does MásMóvil Ibercom's P/E Ratio Compare To Its Peers?
We can get an indication of market expectations by looking at the P/E ratio. The image below shows that MásMóvil Ibercom has a higher P/E than the average (17.1) P/E for companies in the telecom industry.
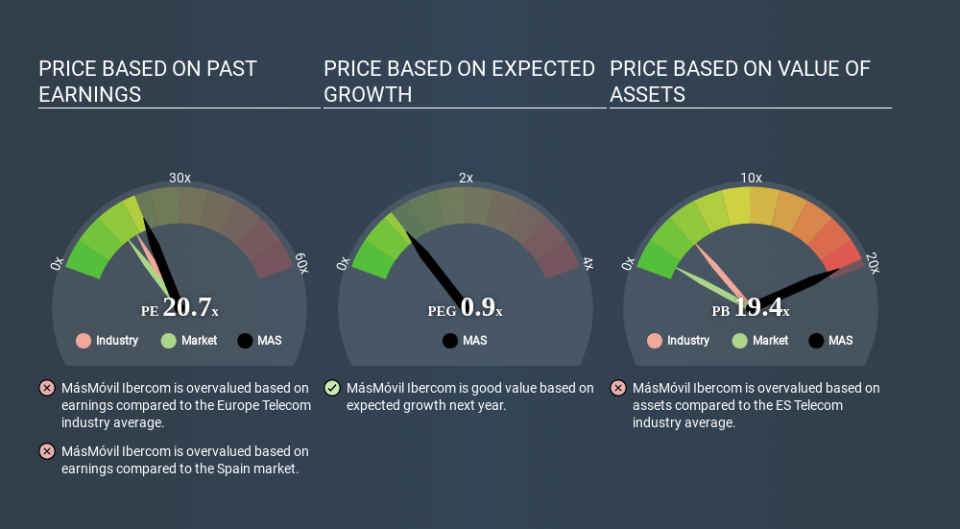
Its relatively high P/E ratio indicates that MásMóvil Ibercom shareholders think it will perform better than other companies in its industry classification. Clearly the market expects growth, but it isn't guaranteed. So further research is always essential. I often monitor director buying and selling.
How Growth Rates Impact P/E Ratios
Probably the most important factor in determining what P/E a company trades on is the earnings growth. If earnings are growing quickly, then the 'E' in the equation will increase faster than it would otherwise. Therefore, even if you pay a high multiple of earnings now, that multiple will become lower in the future. And as that P/E ratio drops, the company will look cheap, unless its share price increases.
Notably, MásMóvil Ibercom grew EPS by a whopping 25% in the last year. And its annual EPS growth rate over 5 years is 205%. I'd therefore be a little surprised if its P/E ratio was not relatively high.
Don't Forget: The P/E Does Not Account For Debt or Bank Deposits
One drawback of using a P/E ratio is that it considers market capitalization, but not the balance sheet. So it won't reflect the advantage of cash, or disadvantage of debt. In theory, a company can lower its future P/E ratio by using cash or debt to invest in growth.
Such expenditure might be good or bad, in the long term, but the point here is that the balance sheet is not reflected by this ratio.
MásMóvil Ibercom's Balance Sheet
MásMóvil Ibercom has net debt worth 69% of its market capitalization. If you want to compare its P/E ratio to other companies, you should absolutely keep in mind it has significant borrowings.
The Bottom Line On MásMóvil Ibercom's P/E Ratio
MásMóvil Ibercom trades on a P/E ratio of 20.7, which is above its market average of 14.1. While the meaningful level of debt does limit its options, it has achieved solid growth over the last year. But if growth falters, the relatively high P/E ratio may prove to be unjustified.
When the market is wrong about a stock, it gives savvy investors an opportunity. As value investor Benjamin Graham famously said, 'In the short run, the market is a voting machine but in the long run, it is a weighing machine. So this free visual report on analyst forecasts could hold the key to an excellent investment decision.
You might be able to find a better buy than MásMóvil Ibercom. If you want a selection of possible winners, check out this free list of interesting companies that trade on a P/E below 20 (but have proven they can grow earnings).
If you spot an error that warrants correction, please contact the editor at editorial-team@simplywallst.com. This article by Simply Wall St is general in nature. It does not constitute a recommendation to buy or sell any stock, and does not take account of your objectives, or your financial situation. Simply Wall St has no position in the stocks mentioned.
We aim to bring you long-term focused research analysis driven by fundamental data. Note that our analysis may not factor in the latest price-sensitive company announcements or qualitative material. Thank you for reading.

