Don't Sell MBB SE (ETR:MBB) Before You Read This

This article is written for those who want to get better at using price to earnings ratios (P/E ratios). To keep it practical, we'll show how MBB SE's (ETR:MBB) P/E ratio could help you assess the value on offer. Looking at earnings over the last twelve months, MBB has a P/E ratio of 11.78. That corresponds to an earnings yield of approximately 8.5%.
View our latest analysis for MBB
How Do I Calculate A Price To Earnings Ratio?
The formula for P/E is:
Price to Earnings Ratio = Price per Share ÷ Earnings per Share (EPS)
Or for MBB:
P/E of 11.78 = €48.000 ÷ €4.075 (Based on the trailing twelve months to September 2019.)
(Note: the above calculation results may not be precise due to rounding.)
Is A High Price-to-Earnings Ratio Good?
A higher P/E ratio means that investors are paying a higher price for each €1 of company earnings. That is not a good or a bad thing per se, but a high P/E does imply buyers are optimistic about the future.
How Does MBB's P/E Ratio Compare To Its Peers?
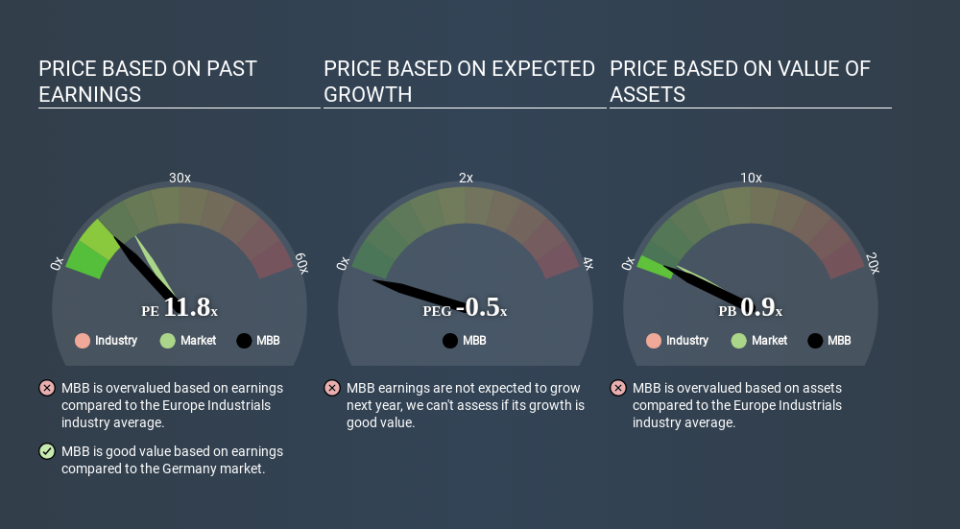
One good way to get a quick read on what market participants expect of a company is to look at its P/E ratio. The image below shows that MBB has a P/E ratio that is roughly in line with the industrials industry average (11.3).
Its P/E ratio suggests that MBB shareholders think that in the future it will perform about the same as other companies in its industry classification. So if MBB actually outperforms its peers going forward, that should be a positive for the share price. Further research into factors such as insider buying and selling, could help you form your own view on whether that is likely.
How Growth Rates Impact P/E Ratios
Generally speaking the rate of earnings growth has a profound impact on a company's P/E multiple. That's because companies that grow earnings per share quickly will rapidly increase the 'E' in the equation. That means unless the share price increases, the P/E will reduce in a few years. And as that P/E ratio drops, the company will look cheap, unless its share price increases.
MBB's 98% EPS improvement over the last year was like bamboo growth after rain; rapid and impressive. And earnings per share have improved by 24% annually, over the last three years. So we'd absolutely expect it to have a relatively high P/E ratio.
A Limitation: P/E Ratios Ignore Debt and Cash In The Bank
Don't forget that the P/E ratio considers market capitalization. In other words, it does not consider any debt or cash that the company may have on the balance sheet. In theory, a company can lower its future P/E ratio by using cash or debt to invest in growth.
Spending on growth might be good or bad a few years later, but the point is that the P/E ratio does not account for the option (or lack thereof).
Is Debt Impacting MBB's P/E?
MBB has net cash of €92m. This is fairly high at 32% of its market capitalization. That might mean balance sheet strength is important to the business, but should also help push the P/E a bit higher than it would otherwise be.
The Bottom Line On MBB's P/E Ratio
MBB trades on a P/E ratio of 11.8, which is below the DE market average of 16.5. Not only should the net cash position reduce risk, but the recent growth has been impressive. The relatively low P/E ratio implies the market is pessimistic.
Investors have an opportunity when market expectations about a stock are wrong. If it is underestimating a company, investors can make money by buying and holding the shares until the market corrects itself. So this free visualization of the analyst consensus on future earnings could help you make the right decision about whether to buy, sell, or hold.
You might be able to find a better buy than MBB. If you want a selection of possible winners, check out this free list of interesting companies that trade on a P/E below 20 (but have proven they can grow earnings).
If you spot an error that warrants correction, please contact the editor at editorial-team@simplywallst.com. This article by Simply Wall St is general in nature. It does not constitute a recommendation to buy or sell any stock, and does not take account of your objectives, or your financial situation. Simply Wall St has no position in the stocks mentioned.
We aim to bring you long-term focused research analysis driven by fundamental data. Note that our analysis may not factor in the latest price-sensitive company announcements or qualitative material. Thank you for reading.

