Don't Sell OceanaGold Corporation (TSE:OGC) Before You Read This

Want to participate in a short research study? Help shape the future of investing tools and you could win a $250 gift card!
The goal of this article is to teach you how to use price to earnings ratios (P/E ratios). We'll show how you can use OceanaGold Corporation's (TSE:OGC) P/E ratio to inform your assessment of the investment opportunity. OceanaGold has a P/E ratio of 19.05, based on the last twelve months. That means that at current prices, buyers pay CA$19.05 for every CA$1 in trailing yearly profits.
See our latest analysis for OceanaGold
How Do You Calculate A P/E Ratio?
The formula for price to earnings is:
Price to Earnings Ratio = Price per Share (in the reporting currency) ÷ Earnings per Share (EPS)
Or for OceanaGold:
P/E of 19.05 = $2.76 (Note: this is the share price in the reporting currency, namely, USD ) ÷ $0.14 (Based on the year to March 2019.)
Is A High Price-to-Earnings Ratio Good?
The higher the P/E ratio, the higher the price tag of a business, relative to its trailing earnings. That isn't a good or a bad thing on its own, but a high P/E means that buyers have a higher opinion of the business's prospects, relative to stocks with a lower P/E.
How Growth Rates Impact P/E Ratios
Generally speaking the rate of earnings growth has a profound impact on a company's P/E multiple. That's because companies that grow earnings per share quickly will rapidly increase the 'E' in the equation. And in that case, the P/E ratio itself will drop rather quickly. A lower P/E should indicate the stock is cheap relative to others -- and that may attract buyers.
OceanaGold's earnings per share fell by 51% in the last twelve months. But it has grown its earnings per share by 60% per year over the last five years.
How Does OceanaGold's P/E Ratio Compare To Its Peers?
The P/E ratio essentially measures market expectations of a company. You can see in the image below that the average P/E (13.6) for companies in the metals and mining industry is lower than OceanaGold's P/E.
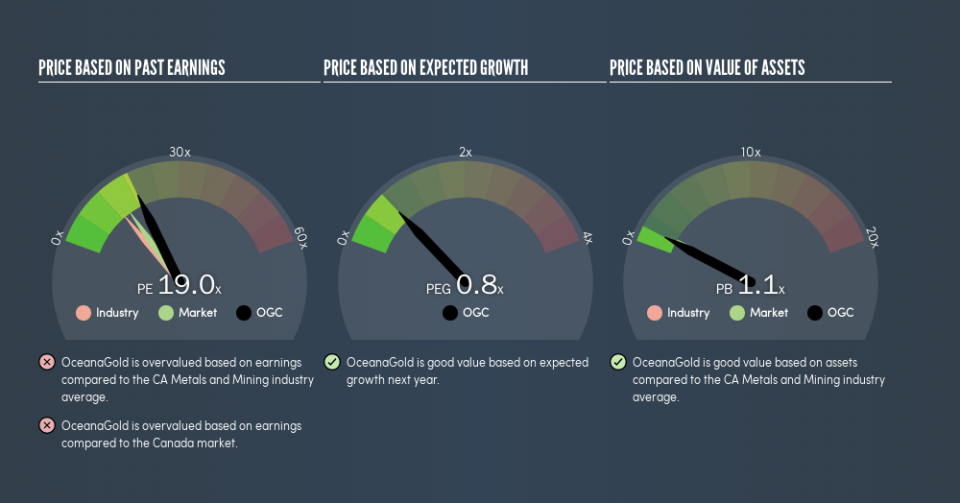
OceanaGold's P/E tells us that market participants think the company will perform better than its industry peers, going forward. Shareholders are clearly optimistic, but the future is always uncertain. So further research is always essential. I often monitor director buying and selling.
A Limitation: P/E Ratios Ignore Debt and Cash In The Bank
One drawback of using a P/E ratio is that it considers market capitalization, but not the balance sheet. In other words, it does not consider any debt or cash that the company may have on the balance sheet. Hypothetically, a company could reduce its future P/E ratio by spending its cash (or taking on debt) to achieve higher earnings.
While growth expenditure doesn't always pay off, the point is that it is a good option to have; but one that the P/E ratio ignores.
So What Does OceanaGold's Balance Sheet Tell Us?
OceanaGold's net debt is 5.8% of its market cap. The market might award it a higher P/E ratio if it had net cash, but its unlikely this low level of net borrowing is having a big impact on the P/E multiple.
The Bottom Line On OceanaGold's P/E Ratio
OceanaGold has a P/E of 19. That's higher than the average in the CA market, which is 14.9. With modest debt but no EPS growth in the last year, it's fair to say the P/E implies some optimism about future earnings, from the market.
When the market is wrong about a stock, it gives savvy investors an opportunity. People often underestimate remarkable growth -- so investors can make money when fast growth is not fully appreciated. So this free visualization of the analyst consensus on future earnings could help you make the right decision about whether to buy, sell, or hold.
You might be able to find a better buy than OceanaGold. If you want a selection of possible winners, check out this free list of interesting companies that trade on a P/E below 20 (but have proven they can grow earnings).
We aim to bring you long-term focused research analysis driven by fundamental data. Note that our analysis may not factor in the latest price-sensitive company announcements or qualitative material.
If you spot an error that warrants correction, please contact the editor at editorial-team@simplywallst.com. This article by Simply Wall St is general in nature. It does not constitute a recommendation to buy or sell any stock, and does not take account of your objectives, or your financial situation. Simply Wall St has no position in the stocks mentioned. Thank you for reading.

