Don't Sell PannErgy Plc (BUSE:PANNERGY) Before You Read This

Want to participate in a short research study? Help shape the future of investing tools and you could win a $250 gift card!
This article is written for those who want to get better at using price to earnings ratios (P/E ratios). We'll show how you can use PannErgy Plc's (BUSE:PANNERGY) P/E ratio to inform your assessment of the investment opportunity. PannErgy has a P/E ratio of 30.57, based on the last twelve months. That means that at current prices, buyers pay HUF30.57 for every HUF1 in trailing yearly profits.
See our latest analysis for PannErgy
How Do I Calculate PannErgy's Price To Earnings Ratio?
The formula for price to earnings is:
Price to Earnings Ratio = Share Price ÷ Earnings per Share (EPS)
Or for PannErgy:
P/E of 30.57 = HUF720 ÷ HUF23.55 (Based on the trailing twelve months to December 2018.)
Is A High Price-to-Earnings Ratio Good?
The higher the P/E ratio, the higher the price tag of a business, relative to its trailing earnings. All else being equal, it's better to pay a low price -- but as Warren Buffett said, 'It's far better to buy a wonderful company at a fair price than a fair company at a wonderful price.'
How Growth Rates Impact P/E Ratios
Probably the most important factor in determining what P/E a company trades on is the earnings growth. Earnings growth means that in the future the 'E' will be higher. And in that case, the P/E ratio itself will drop rather quickly. And as that P/E ratio drops, the company will look cheap, unless its share price increases.
PannErgy shrunk earnings per share by 15% over the last year. But it has grown its earnings per share by 77% per year over the last three years.
Does PannErgy Have A Relatively High Or Low P/E For Its Industry?
We can get an indication of market expectations by looking at the P/E ratio. The image below shows that PannErgy has a higher P/E than the average (26.7) P/E for companies in the renewable energy industry.
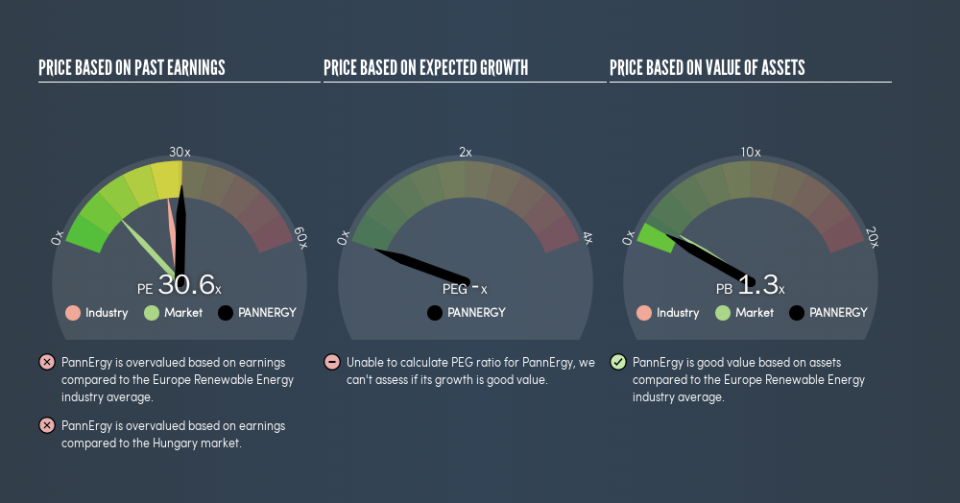
That means that the market expects PannErgy will outperform other companies in its industry. Clearly the market expects growth, but it isn't guaranteed. So investors should always consider the P/E ratio alongside other factors, such as whether company directors have been buying shares.
Don't Forget: The P/E Does Not Account For Debt or Bank Deposits
The 'Price' in P/E reflects the market capitalization of the company. That means it doesn't take debt or cash into account. Theoretically, a business can improve its earnings (and produce a lower P/E in the future) by investing in growth. That means taking on debt (or spending its cash).
Spending on growth might be good or bad a few years later, but the point is that the P/E ratio does not account for the option (or lack thereof).
How Does PannErgy's Debt Impact Its P/E Ratio?
PannErgy's net debt is 70% of its market cap. This is enough debt that you'd have to make some adjustments before using the P/E ratio to compare it to a company with net cash.
The Bottom Line On PannErgy's P/E Ratio
PannErgy trades on a P/E ratio of 30.6, which is above the HU market average of 11.7. With meaningful debt and a lack of recent earnings growth, the market has high expectations that the business will earn more in the future.
When the market is wrong about a stock, it gives savvy investors an opportunity. As value investor Benjamin Graham famously said, 'In the short run, the market is a voting machine but in the long run, it is a weighing machine.' We don't have analyst forecasts, but you might want to assess this data-rich visualization of earnings, revenue and cash flow.
Of course you might be able to find a better stock than PannErgy. So you may wish to see this free collection of other companies that have grown earnings strongly.
We aim to bring you long-term focused research analysis driven by fundamental data. Note that our analysis may not factor in the latest price-sensitive company announcements or qualitative material.
If you spot an error that warrants correction, please contact the editor at editorial-team@simplywallst.com. This article by Simply Wall St is general in nature. It does not constitute a recommendation to buy or sell any stock, and does not take account of your objectives, or your financial situation. Simply Wall St has no position in the stocks mentioned. Thank you for reading.

