Don't Sell Schindler Holding AG (VTX:SCHN) Before You Read This

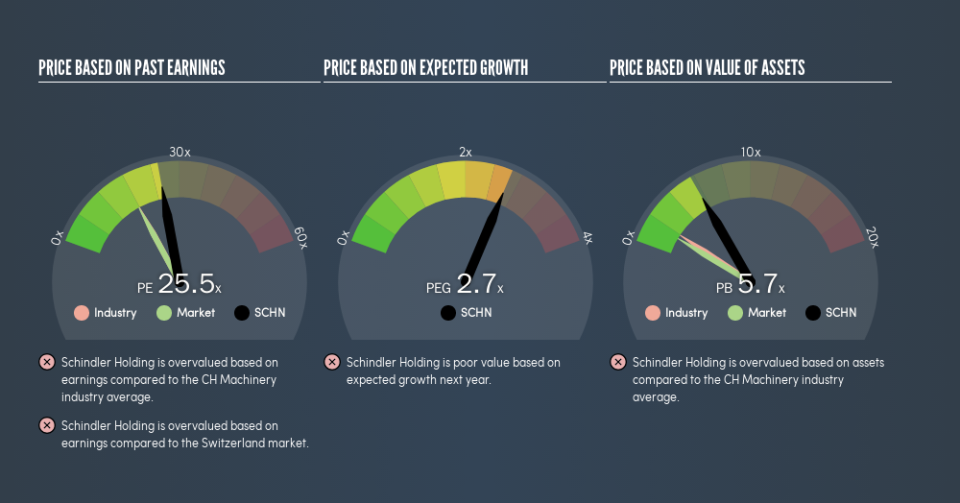
The goal of this article is to teach you how to use price to earnings ratios (P/E ratios). We'll look at Schindler Holding AG's (VTX:SCHN) P/E ratio and reflect on what it tells us about the company's share price. What is Schindler Holding's P/E ratio? Well, based on the last twelve months it is 25.54. In other words, at today's prices, investors are paying CHF25.54 for every CHF1 in prior year profit.
Check out our latest analysis for Schindler Holding
How Do You Calculate Schindler Holding's P/E Ratio?
The formula for price to earnings is:
Price to Earnings Ratio = Share Price ÷ Earnings per Share (EPS)
Or for Schindler Holding:
P/E of 25.54 = CHF205.4 ÷ CHF8.04 (Based on the year to June 2019.)
Is A High Price-to-Earnings Ratio Good?
A higher P/E ratio means that investors are paying a higher price for each CHF1 of company earnings. That isn't necessarily good or bad, but a high P/E implies relatively high expectations of what a company can achieve in the future.
Does Schindler Holding Have A Relatively High Or Low P/E For Its Industry?
One good way to get a quick read on what market participants expect of a company is to look at its P/E ratio. As you can see below, Schindler Holding has a higher P/E than the average company (17.9) in the machinery industry.
Schindler Holding's P/E tells us that market participants think the company will perform better than its industry peers, going forward. Shareholders are clearly optimistic, but the future is always uncertain. So investors should always consider the P/E ratio alongside other factors, such as whether company directors have been buying shares.
How Growth Rates Impact P/E Ratios
Probably the most important factor in determining what P/E a company trades on is the earnings growth. That's because companies that grow earnings per share quickly will rapidly increase the 'E' in the equation. Therefore, even if you pay a high multiple of earnings now, that multiple will become lower in the future. And as that P/E ratio drops, the company will look cheap, unless its share price increases.
Schindler Holding shrunk earnings per share by 6.1% last year. But it has grown its earnings per share by 8.8% per year over the last five years.
Remember: P/E Ratios Don't Consider The Balance Sheet
It's important to note that the P/E ratio considers the market capitalization, not the enterprise value. In other words, it does not consider any debt or cash that the company may have on the balance sheet. The exact same company would hypothetically deserve a higher P/E ratio if it had a strong balance sheet, than if it had a weak one with lots of debt, because a cashed up company can spend on growth.
Such spending might be good or bad, overall, but the key point here is that you need to look at debt to understand the P/E ratio in context.
How Does Schindler Holding's Debt Impact Its P/E Ratio?
Since Schindler Holding holds net cash of CHF1.6b, it can spend on growth, justifying a higher P/E ratio than otherwise.
The Bottom Line On Schindler Holding's P/E Ratio
Schindler Holding's P/E is 25.5 which is above average (17.8) in its market. The recent drop in earnings per share might keep value investors away, but the relatively strong balance sheet will allow the company time to invest in growth. Clearly, the high P/E indicates shareholders think it will!
Investors have an opportunity when market expectations about a stock are wrong. As value investor Benjamin Graham famously said, 'In the short run, the market is a voting machine but in the long run, it is a weighing machine.' So this free report on the analyst consensus forecasts could help you make a master move on this stock.
Of course, you might find a fantastic investment by looking at a few good candidates. So take a peek at this free list of companies with modest (or no) debt, trading on a P/E below 20.
We aim to bring you long-term focused research analysis driven by fundamental data. Note that our analysis may not factor in the latest price-sensitive company announcements or qualitative material.
If you spot an error that warrants correction, please contact the editor at editorial-team@simplywallst.com. This article by Simply Wall St is general in nature. It does not constitute a recommendation to buy or sell any stock, and does not take account of your objectives, or your financial situation. Simply Wall St has no position in the stocks mentioned. Thank you for reading.

