Don't Sell Shanthi Gears Limited (NSE:SHANTIGEAR) Before You Read This

Want to participate in a short research study? Help shape the future of investing tools and you could win a $250 gift card!
Today, we'll introduce the concept of the P/E ratio for those who are learning about investing. We'll look at Shanthi Gears Limited's (NSE:SHANTIGEAR) P/E ratio and reflect on what it tells us about the company's share price. Looking at earnings over the last twelve months, Shanthi Gears has a P/E ratio of 28.2. In other words, at today's prices, investors are paying ₹28.2 for every ₹1 in prior year profit.
Check out our latest analysis for Shanthi Gears
How Do I Calculate A Price To Earnings Ratio?
The formula for P/E is:
Price to Earnings Ratio = Share Price ÷ Earnings per Share (EPS)
Or for Shanthi Gears:
P/E of 28.2 = ₹115.05 ÷ ₹4.08 (Based on the year to March 2019.)
Is A High Price-to-Earnings Ratio Good?
The higher the P/E ratio, the higher the price tag of a business, relative to its trailing earnings. All else being equal, it's better to pay a low price -- but as Warren Buffett said, 'It's far better to buy a wonderful company at a fair price than a fair company at a wonderful price.'
How Growth Rates Impact P/E Ratios
P/E ratios primarily reflect market expectations around earnings growth rates. If earnings are growing quickly, then the 'E' in the equation will increase faster than it would otherwise. Therefore, even if you pay a high multiple of earnings now, that multiple will become lower in the future. And as that P/E ratio drops, the company will look cheap, unless its share price increases.
Shanthi Gears increased earnings per share by an impressive 17% over the last twelve months. And it has bolstered its earnings per share by 13% per year over the last five years. So one might expect an above average P/E ratio.
How Does Shanthi Gears's P/E Ratio Compare To Its Peers?
We can get an indication of market expectations by looking at the P/E ratio. As you can see below, Shanthi Gears has a higher P/E than the average company (15) in the machinery industry.
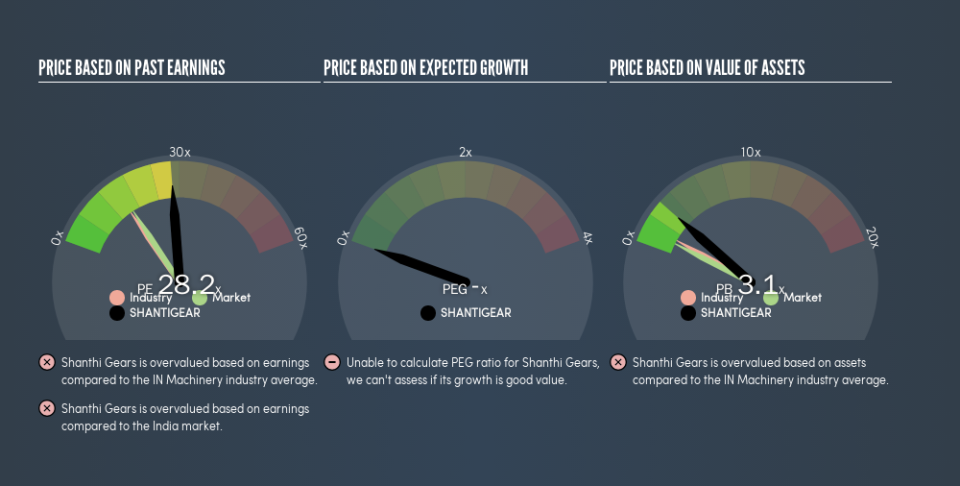
That means that the market expects Shanthi Gears will outperform other companies in its industry. Clearly the market expects growth, but it isn't guaranteed. So investors should delve deeper. I like to check if company insiders have been buying or selling.
Don't Forget: The P/E Does Not Account For Debt or Bank Deposits
It's important to note that the P/E ratio considers the market capitalization, not the enterprise value. That means it doesn't take debt or cash into account. In theory, a company can lower its future P/E ratio by using cash or debt to invest in growth.
While growth expenditure doesn't always pay off, the point is that it is a good option to have; but one that the P/E ratio ignores.
How Does Shanthi Gears's Debt Impact Its P/E Ratio?
Shanthi Gears has net cash of ₹1.3b. This is fairly high at 15% of its market capitalization. That might mean balance sheet strength is important to the business, but should also help push the P/E a bit higher than it would otherwise be.
The Verdict On Shanthi Gears's P/E Ratio
Shanthi Gears's P/E is 28.2 which is above average (15.8) in the IN market. Its net cash position supports a higher P/E ratio, as does its solid recent earnings growth. So it does not seem strange that the P/E is above average.
Investors should be looking to buy stocks that the market is wrong about. As value investor Benjamin Graham famously said, 'In the short run, the market is a voting machine but in the long run, it is a weighing machine.' So this free report on the analyst consensus forecasts could help you make a master move on this stock.
Of course you might be able to find a better stock than Shanthi Gears. So you may wish to see this free collection of other companies that have grown earnings strongly.
We aim to bring you long-term focused research analysis driven by fundamental data. Note that our analysis may not factor in the latest price-sensitive company announcements or qualitative material.
If you spot an error that warrants correction, please contact the editor at editorial-team@simplywallst.com. This article by Simply Wall St is general in nature. It does not constitute a recommendation to buy or sell any stock, and does not take account of your objectives, or your financial situation. Simply Wall St has no position in the stocks mentioned. Thank you for reading.
