Douglas Dynamics (NYSE:PLOW) Has Gifted Shareholders With A Fantastic 157% Total Return On Their Investment
The worst result, after buying shares in a company (assuming no leverage), would be if you lose all the money you put in. But when you pick a company that is really flourishing, you can make more than 100%. One great example is Douglas Dynamics, Inc. (NYSE:PLOW) which saw its share price drive 121% higher over five years. On top of that, the share price is up 17% in about a quarter. The company reported its financial results recently; you can catch up on the latest numbers by reading our company report.
View our latest analysis for Douglas Dynamics
While markets are a powerful pricing mechanism, share prices reflect investor sentiment, not just underlying business performance. One flawed but reasonable way to assess how sentiment around a company has changed is to compare the earnings per share (EPS) with the share price.
During five years of share price growth, Douglas Dynamics actually saw its EPS drop 35% per year. The impact of extraordinary items on earnings, in the last year, partially explain the diversion.
This means it's unlikely the market is judging the company based on earnings growth. Since the change in EPS doesn't seem to correlate with the change in share price, it's worth taking a look at other metrics.
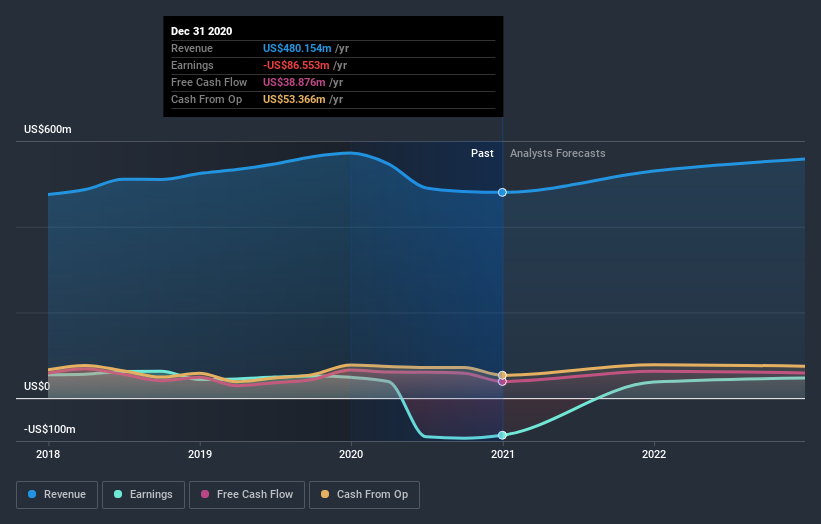
On the other hand, Douglas Dynamics' revenue is growing nicely, at a compound rate of 5.9% over the last five years. In that case, the company may be sacrificing current earnings per share to drive growth.
You can see below how earnings and revenue have changed over time (discover the exact values by clicking on the image).
If you are thinking of buying or selling Douglas Dynamics stock, you should check out this FREE detailed report on its balance sheet.
What About Dividends?
As well as measuring the share price return, investors should also consider the total shareholder return (TSR). The TSR incorporates the value of any spin-offs or discounted capital raisings, along with any dividends, based on the assumption that the dividends are reinvested. Arguably, the TSR gives a more comprehensive picture of the return generated by a stock. We note that for Douglas Dynamics the TSR over the last 5 years was 157%, which is better than the share price return mentioned above. And there's no prize for guessing that the dividend payments largely explain the divergence!
A Different Perspective
Douglas Dynamics shareholders gained a total return of 21% during the year. Unfortunately this falls short of the market return. The silver lining is that the gain was actually better than the average annual return of 21% per year over five year. This suggests the company might be improving over time. It's always interesting to track share price performance over the longer term. But to understand Douglas Dynamics better, we need to consider many other factors. Consider for instance, the ever-present spectre of investment risk. We've identified 3 warning signs with Douglas Dynamics (at least 1 which shouldn't be ignored) , and understanding them should be part of your investment process.
If you are like me, then you will not want to miss this free list of growing companies that insiders are buying.
Please note, the market returns quoted in this article reflect the market weighted average returns of stocks that currently trade on US exchanges.
This article by Simply Wall St is general in nature. It does not constitute a recommendation to buy or sell any stock, and does not take account of your objectives, or your financial situation. We aim to bring you long-term focused analysis driven by fundamental data. Note that our analysis may not factor in the latest price-sensitive company announcements or qualitative material. Simply Wall St has no position in any stocks mentioned.
Have feedback on this article? Concerned about the content? Get in touch with us directly. Alternatively, email editorial-team (at) simplywallst.com.

