What Is the Dow Jones? 8 Things Every Investor Should Know

This month, the Dow Jones Industrial Average reached an all-time high of 34,561. But it was hardly surprising to investors, who have watched the Dow reach multiple new record highs in 2021.
If you’re new to investing or just new to investing lingo, here are some facts about the Dow to make you a better-informed investor.
Last updated: May 10, 2021

1. The Dow Is a Stock Index
The Dow Jones Industrial Average, created in 1896, is a stock index composed of 30 large, “blue chip” corporations. The Dow has expanded to 30 companies from 20 stocks in 1928.
Today, this index includes Goldman Sachs (GS) 3M (MMM), Disney (DIS), ExxonMobil (XOM), Boeing (BA) and Coca-Cola (KO). Given its legacy value, investors frequently cite its growth and use it to glean investment advice. It doesn’t, however, provide as strong a gauge of broader market performance as the Standard & Poor’s 500 index, which captures the performance of the largest publicly traded companies, or the Russell 2000, which captures small-cap growth.
Read: Why It’s Never a Bad Idea To Invest In Apple and These Other Companies

2. The Dow Has Interesting Ties to The Wall Street Journal
Three men founded the Dow Jones index, but only two of them carry the name. Charles Dow was an American journalist who founded The Wall Street Journal in 1889. He founded Dow Jones and Company in 1882 with statistician Edward Jones and Wall Street Journal journalist Charles Bergstresser. Dow developed Dow Theory, a series of principles for analyzing market behavior. His work would later become the basis for future advancement in technical analysis.
Find Out: What Is Options Trading? A Guide for Beginners

3. The Dow Jones Is Not Tied to That Edward Jones
As far as Dow Jones historical data goes, you now know that Charles Dow and Edward Jones have their names tied to the Dow Jones index. But it’s important to note that this Edward Jones was a statistician who died in 1920.
Many connect the Dow Jones with another Edward Jones, an investment banker who founded Edward Jones Investments in 1922 and earned a seat on the New York Stock Exchange in 1942. Today, Edward Jones Investments is a multibillion-dollar company owned by The Jones Financial Companies.
Read More: The Top 10 Stocks for 2021
4. Only One Industrial Company Remains From the Original Index
The original Dow Jones consisted of 12 companies: American Cotton Oil, American Sugar, American Tobacco, Chicago Gas, Distilling & Cattle Feeding, General Electric, Laclede Gas, National Lead, North American, Tennessee Coal and Iron, U.S. Leather pfd. and U.S. Rubber. Each of these firms represented each sector of the stock market.
Today, however, only General Electric remains a component of the Dow Jones index chart. The Dow dropped it twice, but it rejoined in 1907 and has remained for 110 years.
5. The Dow Jones Average Isn’t a True Average
The DJIA is not a true average as its name might suggest. For this reason, people are frequently confused by how the Dow is calculated.
To obtain the value of the DJIA, you must add the prices of all 30 stocks and then divide that figure by a divisor. That divisor right now is 0.14523396877348. That means you would multiply the total value of all Dow 30 stocks by about seven. And that means that every $1 price change in one of these 30 stocks leads to about a seven-point change in the DJIA.
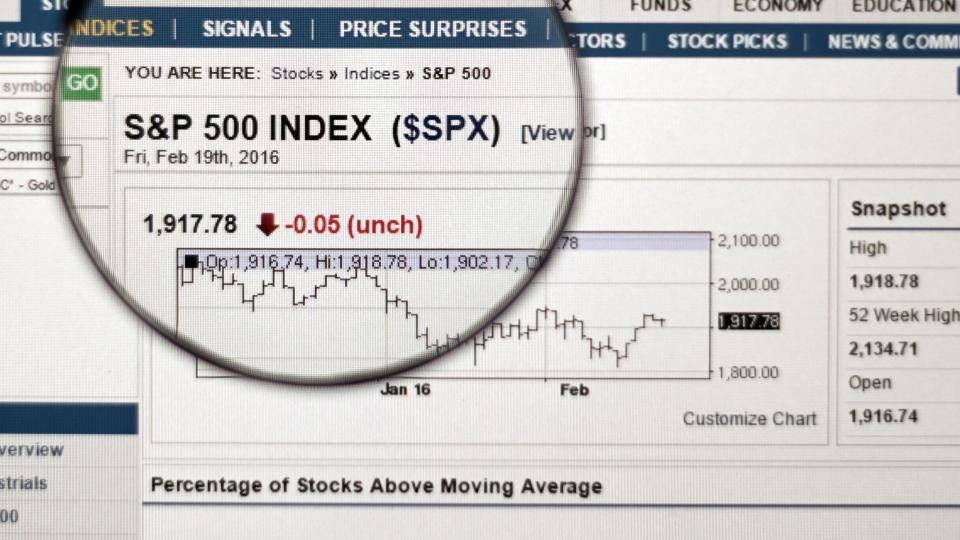
6. The DJIA Is Less Diverse Than Another Index
The Dow Jones typically steals all the headlines, but another index provides a better representation of broader market performance. Back at the end of the 19th century, the Dow’s 12 original companies provided a strong understanding of market performance in a much smaller market.
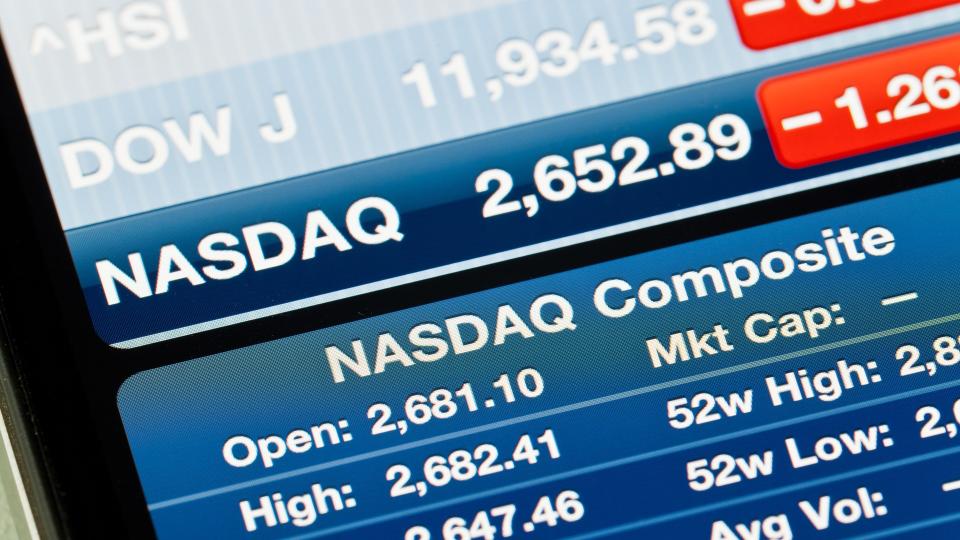
The S&P 500 index today better captures the performance of the market’s sheer size. It also comprises a number of massive public companies that the Dow has ignored despite their meteoric rise. These companies include Facebook (FB), Google-parent Alphabet (GOOGL), Amazon.com (AMZN) and Netflix (NFLX). The S&P 500 includes 500 companies listed on the New York Stock Exchange and Nasdaq, and accounts for about 75% of all movement in the U.S. stock market.
See: Stocks That Would Have Made You Rich Today
7. The Dow Adds and Drops Companies From Its Index
Companies grow and mature over time. Sometimes, small tech companies that started on the Nasdaq become mega-firms that play a huge role in the U.S. economy. Given their weight, the Dow Jones might add one of these firms to reflect the strength of the market, replacing another company on the list.
In May 2015, Apple (AAPL) finally joined the Dow after decades of trading publicly — it replaced AT&T Corporation (T). In September 2017, DowDuPont replaced DuPont when it joined the DJIA after a merger between The Dow Chemical Company and DuPont. In its history, more than 120 companies have been Dow components.

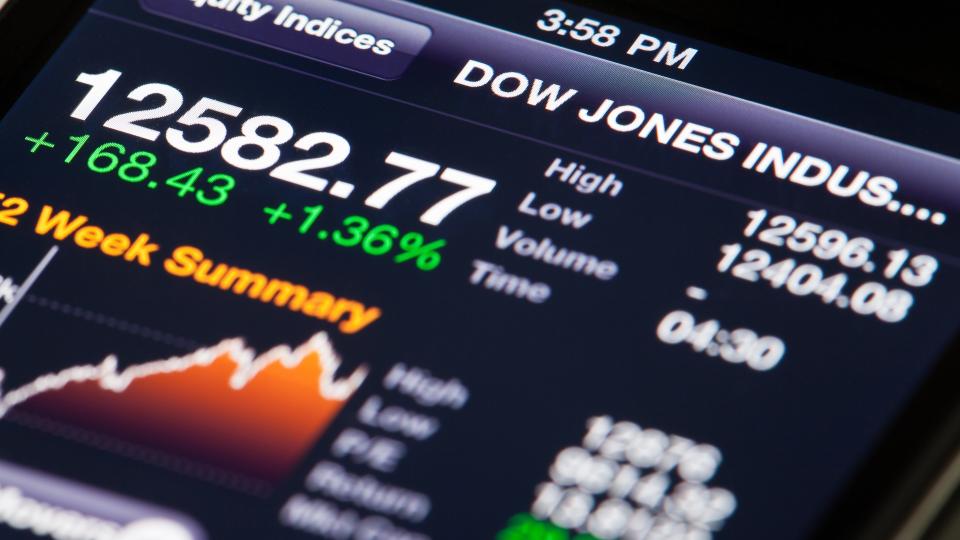
8. The Dow Jones Chart Is Very Straightforward
When it comes to the Dow chart, its founders wanted you to be able to read and understand it easily. Here’s how you can read and follow the Dow chart:
1. The horizontal axis displays the time period. You can adjust the graph to reflect performance ranging from one day to 10 years.
2. The vertical axis lists the value of the index.
3. The line graph shows the actual value of the Dow during the time period.
4. The vertical bars at the bottom of the chart show the volume — that is, the number of shares — traded.
5. The green bars at the bottom explain that the index closed at a higher price than the prior day, and the red bars mean it closed at a lower price.
Reading any stock chart is a good way to notice stock price and volume trends. You can use Dow chart information as a data source for stock market index research, and it might be useful if you’re considering trading a Dow index fund.
More From GOBankingRates
Money’s Most Influential: Where Do Americans Get Their Financial Advice?
‘Rich Dad Poor Dad’ Author Robert Kiyosaki: You Should Never Say ‘I Can’t Afford That’
Here’s How Much You Should Have in Your 401(k) Account, Based on Your Age
Garrett Baldwin contributed to the reporting for this article.
This article originally appeared on GOBankingRates.com: What Is the Dow Jones? 8 Things Every Investor Should Know
