Are Driver Group plc's (LON:DRV) Fundamentals Good Enough to Warrant Buying Given The Stock's Recent Weakness?
It is hard to get excited after looking at Driver Group's (LON:DRV) recent performance, when its stock has declined 7.5% over the past month. However, the company's fundamentals look pretty decent, and long-term financials are usually aligned with future market price movements. In this article, we decided to focus on Driver Group's ROE.
Return on equity or ROE is an important factor to be considered by a shareholder because it tells them how effectively their capital is being reinvested. In short, ROE shows the profit each dollar generates with respect to its shareholder investments.
See our latest analysis for Driver Group
How Do You Calculate Return On Equity?
ROE can be calculated by using the formula:
Return on Equity = Net Profit (from continuing operations) ÷ Shareholders' Equity
So, based on the above formula, the ROE for Driver Group is:
4.6% = UK£951k ÷ UK£21m (Based on the trailing twelve months to March 2021).
The 'return' is the yearly profit. One way to conceptualize this is that for each £1 of shareholders' capital it has, the company made £0.05 in profit.
What Is The Relationship Between ROE And Earnings Growth?
We have already established that ROE serves as an efficient profit-generating gauge for a company's future earnings. We now need to evaluate how much profit the company reinvests or "retains" for future growth which then gives us an idea about the growth potential of the company. Assuming everything else remains unchanged, the higher the ROE and profit retention, the higher the growth rate of a company compared to companies that don't necessarily bear these characteristics.
Driver Group's Earnings Growth And 4.6% ROE
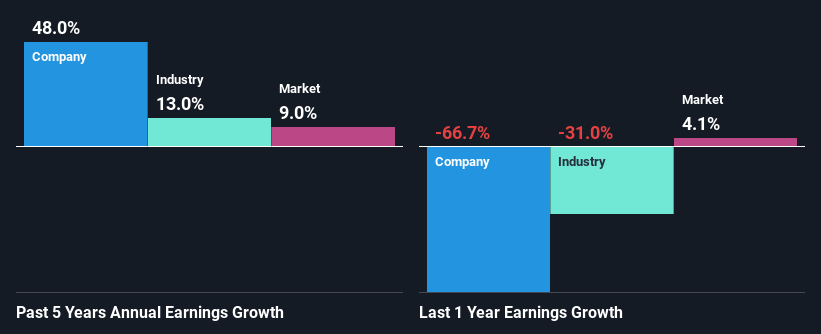
When you first look at it, Driver Group's ROE doesn't look that attractive. Next, when compared to the average industry ROE of 9.1%, the company's ROE leaves us feeling even less enthusiastic. In spite of this, Driver Group was able to grow its net income considerably, at a rate of 48% in the last five years. Therefore, there could be other reasons behind this growth. For instance, the company has a low payout ratio or is being managed efficiently.
As a next step, we compared Driver Group's net income growth with the industry, and pleasingly, we found that the growth seen by the company is higher than the average industry growth of 13%.
Earnings growth is an important metric to consider when valuing a stock. The investor should try to establish if the expected growth or decline in earnings, whichever the case may be, is priced in. Doing so will help them establish if the stock's future looks promising or ominous. One good indicator of expected earnings growth is the P/E ratio which determines the price the market is willing to pay for a stock based on its earnings prospects. So, you may want to check if Driver Group is trading on a high P/E or a low P/E, relative to its industry.
Is Driver Group Using Its Retained Earnings Effectively?
Driver Group's ' three-year median payout ratio is on the lower side at 24% implying that it is retaining a higher percentage (76%) of its profits. So it looks like Driver Group is reinvesting profits heavily to grow its business, which shows in its earnings growth.
Moreover, Driver Group is determined to keep sharing its profits with shareholders which we infer from its long history of paying a dividend for at least ten years.
Summary
In total, it does look like Driver Group has some positive aspects to its business. Even in spite of the low rate of return, the company has posted impressive earnings growth as a result of reinvesting heavily into its business. While we won't completely dismiss the company, what we would do, is try to ascertain how risky the business is to make a more informed decision around the company. To know the 5 risks we have identified for Driver Group visit our risks dashboard for free.
This article by Simply Wall St is general in nature. It does not constitute a recommendation to buy or sell any stock, and does not take account of your objectives, or your financial situation. We aim to bring you long-term focused analysis driven by fundamental data. Note that our analysis may not factor in the latest price-sensitive company announcements or qualitative material. Simply Wall St has no position in any stocks mentioned.
Have feedback on this article? Concerned about the content? Get in touch with us directly. Alternatively, email editorial-team (at) simplywallst.com.

