Is DryShips Inc.’s (NASDAQ:DRYS) Balance Sheet A Threat To Its Future?

Investors are always looking for growth in small-cap stocks like DryShips Inc. (NASDAQ:DRYS), with a market cap of US$539m. However, an important fact which most ignore is: how financially healthy is the business? So, understanding the company’s financial health becomes crucial, as mismanagement of capital can lead to bankruptcies, which occur at a higher rate for small-caps. Here are a few basic checks that are good enough to have a broad overview of the company’s financial strength. Though, this commentary is still very high-level, so I recommend you dig deeper yourself into DRYS here.
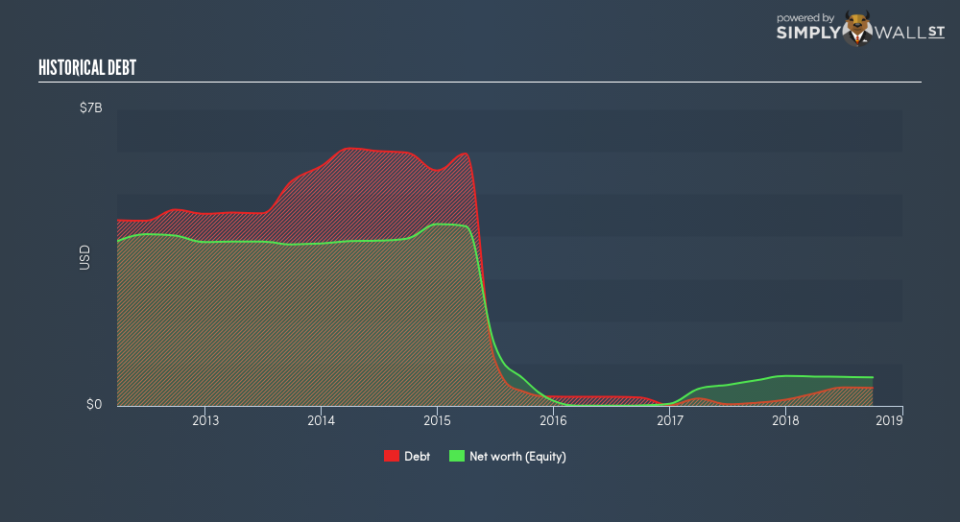
How does DRYS’s operating cash flow stack up against its debt?
DRYS’s debt levels surged from US$73m to US$424m over the last 12 months – this includes long-term debt. With this increase in debt, DRYS currently has US$142m remaining in cash and short-term investments for investing into the business. Additionally, DRYS has generated US$28m in operating cash flow during the same period of time, leading to an operating cash to total debt ratio of 6.6%, meaning that DRYS’s operating cash is not sufficient to cover its debt. This ratio can also be interpreted as a measure of efficiency as an alternative to return on assets. In DRYS’s case, it is able to generate 0.066x cash from its debt capital.
Can DRYS meet its short-term obligations with the cash in hand?
At the current liabilities level of US$48m, it seems that the business has maintained a safe level of current assets to meet its obligations, with the current ratio last standing at 10.14x. However, a ratio greater than 3x may be considered by some to be quite high, however this is not necessarily a negative for the company.
Does DRYS face the risk of succumbing to its debt-load?
With debt reaching 63% of equity, DRYS may be thought of as relatively highly levered. This is not unusual for small-caps as debt tends to be a cheaper and faster source of funding for some businesses. No matter how high the company’s debt, if it can easily cover the interest payments, it’s considered to be efficient with its use of excess leverage. A company generating earnings after interest and tax at least three times its net interest payments is considered financially sound. In DRYS’s case, the ratio of 1.26x suggests that interest is not strongly covered, which means that debtors may be less inclined to loan the company more money, reducing its headroom for growth through debt.
Next Steps:
DRYS’s high cash coverage means that, although its debt levels are high, the company is able to utilise its borrowings efficiently in order to generate cash flow. Since there is also no concerns around DRYS’s liquidity needs, this may be its optimal capital structure for the time being. I admit this is a fairly basic analysis for DRYS’s financial health. Other important fundamentals need to be considered alongside. I suggest you continue to research DryShips to get a more holistic view of the small-cap by looking at:
Historical Performance: What has DRYS’s returns been like over the past? Go into more detail in the past track record analysis and take a look at the free visual representations of our analysis for more clarity.
Other High-Performing Stocks: Are there other stocks that provide better prospects with proven track records? Explore our free list of these great stocks here.
To help readers see past the short term volatility of the financial market, we aim to bring you a long-term focused research analysis purely driven by fundamental data. Note that our analysis does not factor in the latest price-sensitive company announcements.
The author is an independent contributor and at the time of publication had no position in the stocks mentioned. For errors that warrant correction please contact the editor at editorial-team@simplywallst.com.
