Is DTE Energy Company's (NYSE:DTE) P/E Ratio Really That Good?

This article is for investors who would like to improve their understanding of price to earnings ratios (P/E ratios). We'll show how you can use DTE Energy Company's (NYSE:DTE) P/E ratio to inform your assessment of the investment opportunity. Based on the last twelve months, DTE Energy's P/E ratio is 19.87. That is equivalent to an earnings yield of about 5.0%.
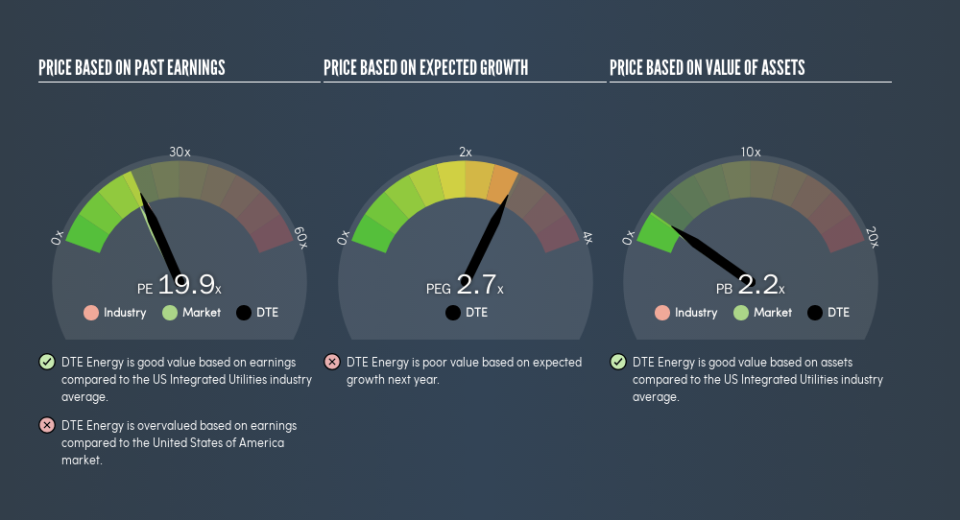
See our latest analysis for DTE Energy
How Do You Calculate DTE Energy's P/E Ratio?
The formula for price to earnings is:
Price to Earnings Ratio = Price per Share ÷ Earnings per Share (EPS)
Or for DTE Energy:
P/E of 19.87 = $122.72 ÷ $6.18 (Based on the trailing twelve months to December 2018.)
Is A High Price-to-Earnings Ratio Good?
A higher P/E ratio means that buyers have to pay a higher price for each $1 the company has earned over the last year. That isn't necessarily good or bad, but a high P/E implies relatively high expectations of what a company can achieve in the future.
How Growth Rates Impact P/E Ratios
Generally speaking the rate of earnings growth has a profound impact on a company's P/E multiple. When earnings grow, the 'E' increases, over time. That means unless the share price increases, the P/E will reduce in a few years. So while a stock may look expensive based on past earnings, it could be cheap based on future earnings.
DTE Energy's earnings per share fell by 2.3% in the last twelve months. But it has grown its earnings per share by 10% per year over the last five years.
Does DTE Energy Have A Relatively High Or Low P/E For Its Industry?
The P/E ratio indicates whether the market has higher or lower expectations of a company. You can see in the image below that the average P/E (20.5) for companies in the integrated utilities industry is roughly the same as DTE Energy's P/E.
Its P/E ratio suggests that DTE Energy shareholders think that in the future it will perform about the same as other companies in its industry classification. So if DTE Energy actually outperforms its peers going forward, that should be a positive for the share price. I inform my view byby checking management tenure and remuneration, among other things.
Don't Forget: The P/E Does Not Account For Debt or Bank Deposits
It's important to note that the P/E ratio considers the market capitalization, not the enterprise value. That means it doesn't take debt or cash into account. The exact same company would hypothetically deserve a higher P/E ratio if it had a strong balance sheet, than if it had a weak one with lots of debt, because a cashed up company can spend on growth.
Such spending might be good or bad, overall, but the key point here is that you need to look at debt to understand the P/E ratio in context.
Is Debt Impacting DTE Energy's P/E?
Net debt totals 63% of DTE Energy's market cap. This is enough debt that you'd have to make some adjustments before using the P/E ratio to compare it to a company with net cash.
The Bottom Line On DTE Energy's P/E Ratio
DTE Energy's P/E is 19.9 which is above average (18) in the US market. With meaningful debt and a lack of recent earnings growth, the market has high expectations that the business will earn more in the future.
Investors should be looking to buy stocks that the market is wrong about. As value investor Benjamin Graham famously said, 'In the short run, the market is a voting machine but in the long run, it is a weighing machine.' So this free visual report on analyst forecasts could hold the key to an excellent investment decision.
You might be able to find a better buy than DTE Energy. If you want a selection of possible winners, check out this free list of interesting companies that trade on a P/E below 20 (but have proven they can grow earnings).
We aim to bring you long-term focused research analysis driven by fundamental data. Note that our analysis may not factor in the latest price-sensitive company announcements or qualitative material.
If you spot an error that warrants correction, please contact the editor at editorial-team@simplywallst.com. This article by Simply Wall St is general in nature. It does not constitute a recommendation to buy or sell any stock, and does not take account of your objectives, or your financial situation. Simply Wall St has no position in the stocks mentioned. Thank you for reading.

