DWF Group (LON:DWF) shareholders have earned a 38% return over the last year
These days it's easy to simply buy an index fund, and your returns should (roughly) match the market. But you can significantly boost your returns by picking above-average stocks. For example, the DWF Group plc (LON:DWF) share price is up 32% in the last 1 year, clearly besting the market decline of around 0.8% (not including dividends). That's a solid performance by our standards! In contrast, the longer term returns are negative, since the share price is 7.6% lower than it was three years ago.
So let's assess the underlying fundamentals over the last 1 year and see if they've moved in lock-step with shareholder returns.
See our latest analysis for DWF Group
While markets are a powerful pricing mechanism, share prices reflect investor sentiment, not just underlying business performance. One way to examine how market sentiment has changed over time is to look at the interaction between a company's share price and its earnings per share (EPS).
Over the last twelve months, DWF Group actually shrank its EPS by 275%. This was, in part, due to extraordinary items impacting earning in the last twelve months.
So we don't think that investors are paying too much attention to EPS. Since the change in EPS doesn't seem to correlate with the change in share price, it's worth taking a look at other metrics.
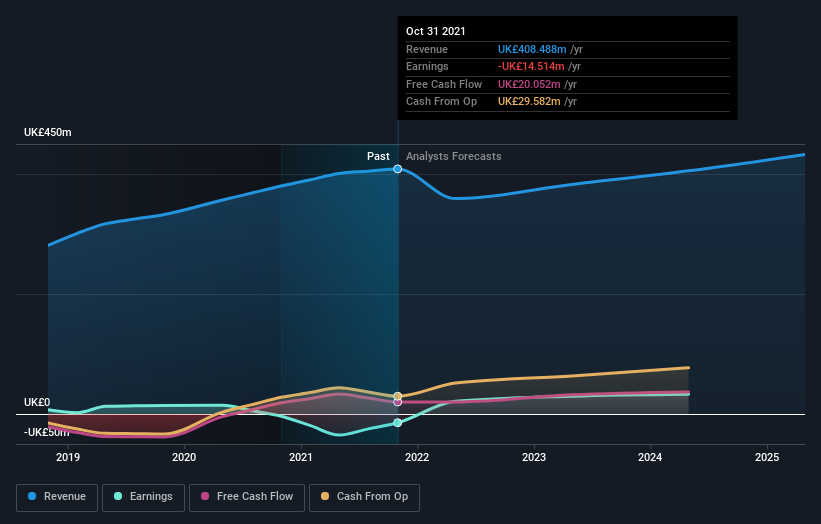
For starters, we suspect the share price has been buoyed by the dividend, which was increased during the year. It could be that the company is reaching maturity and dividend investors are buying for the yield, pushing the price up in the process. Furthermore, the revenue growth of 7.5% probably also encouraged buyers.
The graphic below depicts how earnings and revenue have changed over time (unveil the exact values by clicking on the image).
Balance sheet strength is crucial. It might be well worthwhile taking a look at our free report on how its financial position has changed over time.
What About Dividends?
As well as measuring the share price return, investors should also consider the total shareholder return (TSR). The TSR is a return calculation that accounts for the value of cash dividends (assuming that any dividend received was reinvested) and the calculated value of any discounted capital raisings and spin-offs. So for companies that pay a generous dividend, the TSR is often a lot higher than the share price return. In the case of DWF Group, it has a TSR of 38% for the last 1 year. That exceeds its share price return that we previously mentioned. And there's no prize for guessing that the dividend payments largely explain the divergence!
A Different Perspective
We're pleased to report that DWF Group rewarded shareholders with a total shareholder return of 38% over the last year. That includes the value of the dividend. That gain actually surpasses the 0.6% TSR it generated (per year) over three years. Given the track record of solid returns over varying time frames, it might be worth putting DWF Group on your watchlist. I find it very interesting to look at share price over the long term as a proxy for business performance. But to truly gain insight, we need to consider other information, too. Consider risks, for instance. Every company has them, and we've spotted 2 warning signs for DWF Group you should know about.
If you are like me, then you will not want to miss this free list of growing companies that insiders are buying.
Please note, the market returns quoted in this article reflect the market weighted average returns of stocks that currently trade on GB exchanges.
Have feedback on this article? Concerned about the content? Get in touch with us directly. Alternatively, email editorial-team (at) simplywallst.com.
This article by Simply Wall St is general in nature. We provide commentary based on historical data and analyst forecasts only using an unbiased methodology and our articles are not intended to be financial advice. It does not constitute a recommendation to buy or sell any stock, and does not take account of your objectives, or your financial situation. We aim to bring you long-term focused analysis driven by fundamental data. Note that our analysis may not factor in the latest price-sensitive company announcements or qualitative material. Simply Wall St has no position in any stocks mentioned.

