E-mini NASDAQ-100 Index (NQ) Futures Technical Analysis – Strengthens Over 12946.25, Weakens Under 12808.00
March E-mini NASDAQ-100 Index futures are trading lower shortly after the cash market close as traders awaited the unveiling of a potential big economic stimulus package. The technology-based index was driven lower by weak performances in shares of Facebook, which dropped 2.4%. Amazon, Netflix, Microsoft and Apple all declined by more than 1%. Google-parent Alphabet dipped 0.9%.
At 21:15 GMT, March E-mini NASDAQ-100 Index futures are at 12900.50, down 71.75 or -0.55%.
President-elect Joe Biden is expected on Thursday evening to unveil a stimulus plan that will include a boost to the recent $600 direct payments, an extension of increased unemployment insurance and support for state and local governments. The stimulus could be as big as $2 trillion, CNN reported. The New York Times, meanwhile, said Biden is expected to outline a $1.9 trillion spending plan.
In economic news, first-time claims for unemployment insurance jumped to 965,000 last week, higher than an estimate of 800,000 new claims, according to economists surveyed by Dow Jones.
Daily Swing Chart Technical Analysis
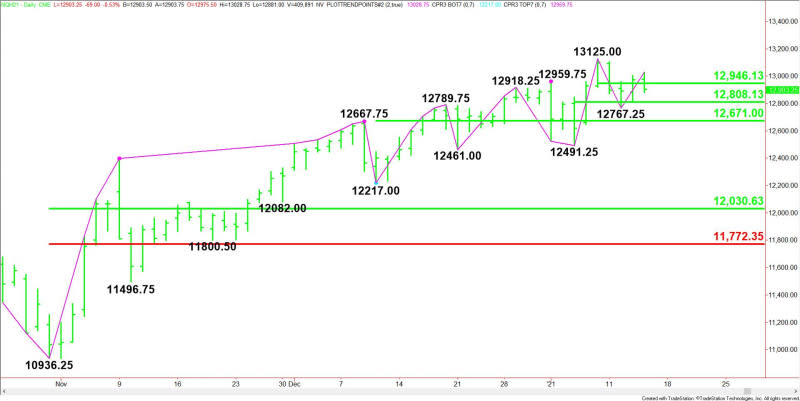
The main trend is up according to the daily swing chart. A trade through 13125.00 will signal a resumption of the uptrend. A move through 12767.25 will change the main trend to down.
The first minor range is 13125.00 to 12767.25. The index is in a position to close on the weak side of its pivot at 12946.25.
The second minor 50% level at 12808.00 provided support on Tuesday.
The short-term range is 12217.00 to 13125.00 if the main trend changes to down then look for the selling pressure to extend into 12671.00.
Short-Term Outlook
Trader reaction to 12946.25 will set the tone into the close and during the pre-market futures trading session.
Bullish Scenario
A sustained move over 12946.25 will indicate the presence of buyers. This could trigger a test of the record high at 13125.00. This is a potential trigger point for an acceleration to the upside.
Bearish Scenario
A sustained move under 12946.00 will signal the presence of sellers. This could trigger a labored break with potential support levels coming in at 12808.00, 12767.25 and 12671.00.
The 50% level at 12671.00 is a potential trigger point for an acceleration to the downside.
For a look at all of today’s economic events, check out our economic calendar.
This article was originally posted on FX Empire

