E-mini S&P 500 Index (ES) Futures Technical Analysis – Trader Reaction to 4192.50 Sets the Tone
September E-mini S&P 500 Index futures are trading flat early Tuesday after finishing sharply higher the previous session as investors jumped back into energy and other sectors expected to outperform as the economy rebounds from the pandemic.
All 11 S&P 500 sector indexes rose, with energy jumping 4.3% and leading the way, followed by financials, up 2.4%.
At 04:01 GMT, September E-mini S&P 500 Index futures are at 4220.25, up 6.50 or +0.15%.
In other news, the S&P 500 Value Index, which includes banks, energy and other economically sensitive sectors and has led gains in U.S. equities so far this year, surged 1.9%, outperforming a 0.9% rise in the growth index.
Daily Swing Chart Technical Analysis
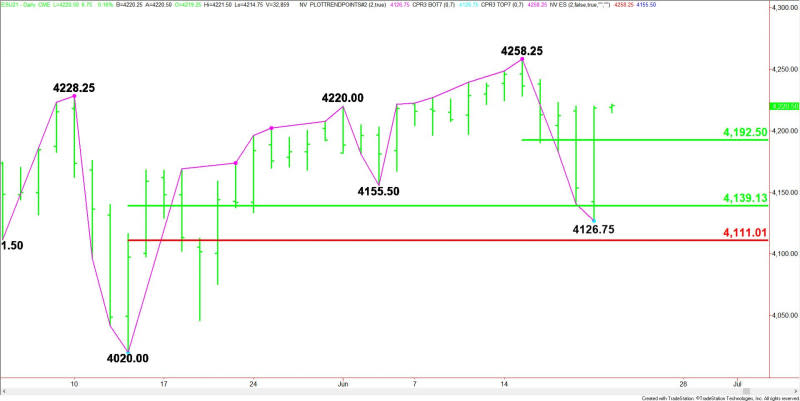
The main trend is down according to the daily swing chart. A trade through 4258.25 will negate last week’s closing price reversal top and change the main trend to up.
A move through 4126.75 will negate yesterday’s closing price reversal bottom and signal a resumption of the downtrend.
The short-term range is 4258.25 to 4126.75. The market is currently trading on the strong side of its 50% level at 4192.50, making it potential support.
The main range is 4020.00 to 4258.25. Its 50% to 61.8% retracement zone at 4139.00 to 4111.00 is the support controlling the near-term direction of the index. It stopped the selling at 4126.75 on Monday.
Daily Swing Chart Technical Forecast
The direction of the September E-mini S&P 500 Index on Tuesday is likely to be determined by trader reaction to the short-term pivot at 4192.50.
Bullish Scenario
A sustained move over 4192.50 will indicate the presence of buyers. If this continues to generate enough upside momentum then look for a near-term test of 4258.25.
Bearish Scenario
A sustained move under 4192.50 will signal the presence of sellers. This could develop into a potentially bearish secondary lower top chart pattern. If confirmed then look for a retest of the main retracement zone at 4139.00 to 4111.00.
For a look at all of today’s economic events, check out our economic calendar.
This article was originally posted on FX Empire
More From FXEMPIRE:
E-mini S&P 500 Index (ES) Futures Technical Analysis – Trader Reaction to 4192.50 Sets the Tone
USD/CAD Price Prediction – The USD/CAD Eases from Overbought Territory
Economic Data Puts the EUR and the GBP in Focus ahead of FED Chair Powell Testimony
Hot Air: Confluent Aims to Become a Value Investment Within a Hype-Driven Tech IPO Market

