E-mini S&P 500 Index (ES) Futures Technical Analysis – Caught Between 50% Levels at 2844.00 and 2880.50
The benchmark S&P 500 Index is trading higher at the mid-session. The strength is being fueled by a temporary easing of U.S. trade restrictions on a major Chinese telecom company.
On Monday night, the U.S. Commerce Department temporarily eased some trade restrictions placed on China’s Huawei Technologies late last week. The news helped drive up technology stocks and the S&P Technology sector.
At 13:15 GMT, June E-mini S&P 500 Index futures are trading 2859.75, up 15.75 or +0.55%.
Daily Technical Analysis
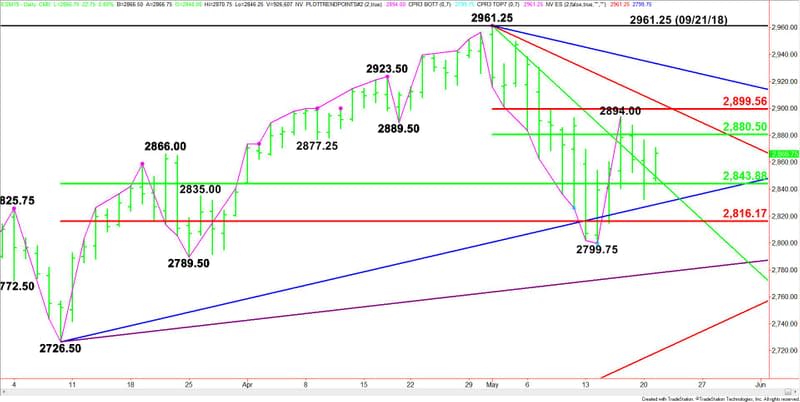
The main trend is down according to the daily swing chart, however, momentum has been trending higher since the formation of a closing price reversal bottom at 2799.75 on May 14.
A trade through 2799.75 will negate the closing price reversal bottom and signal a resumption of the downtrend.
A move through 2894.00 will take out a minor top and indicate the upside momentum is getting stronger.
The main range is 2726.50 to 2961.25. Its retracement zone at 2844.00 to 2816.00 is support.
The short-term range is 2961.25 to 2799.75. Its retracement zone at 2880.50 to 2899.50 is resistance. This zone stopped last week’s rally at 2894.00. Bearish traders are defending this zone in an effort to form a potentially bearish secondary lower top.
Daily Technical Forecast
Based on the earlier price action, the direction of the June E-mini S&P 500 Index into the close is likely to be determined by trader reaction to the downtrending Gann angle at 2849.25. Currently, the market is trading on the bullish side of this angle.
Bullish Scenario
A sustained move over 2849.25 will indicate the presence of buyers. If the upside momentum continues then look for buyers to challenge the 50% level at 2880.50. Sellers may come in on the first test of this level.
Overtaking 2880.50 will indicate the buying is getting stronger. This could lead to a test of the minor top at 2894.00 and the short-term Fibonacci level at 2899.50.
Bearish Scenario
Sellers are defending the retracement zone at 2880.50 to 2899.50. They are trying to produce a secondary lower top.
Falling back below the angle at 2849.25 will signal the presence of sellers. Crossing to the weak side of the 50% level at 2844.00 will indicate the selling is getting stronger. This could lead to a test of the long-term uptrending Gann angle at 2828.50, followed by the major Fibonacci level at 2816.00.
This article was originally posted on FX Empire
More From FXEMPIRE:
Crude Oil Price Forecast – Crude oil markets continue to struggle at resistance
Forex Daily Recap – RBA Minutes Hinted for a Rate Cut Triggering Heavy Selling in the Aussie Pair
USD/JPY Price Forecast – US dollar rallies against Japanese yen
S&P 500 Price Forecast – Stock markets recover slightly on Tuesday

