Is Emova Group (EPA:ALEMV) A Risky Investment?

The external fund manager backed by Berkshire Hathaway's Charlie Munger, Li Lu, makes no bones about it when he says 'The biggest investment risk is not the volatility of prices, but whether you will suffer a permanent loss of capital.' When we think about how risky a company is, we always like to look at its use of debt, since debt overload can lead to ruin. We note that Emova Group SA (EPA:ALEMV) does have debt on its balance sheet. But should shareholders be worried about its use of debt?
What Risk Does Debt Bring?
Debt is a tool to help businesses grow, but if a business is incapable of paying off its lenders, then it exists at their mercy. In the worst case scenario, a company can go bankrupt if it cannot pay its creditors. However, a more common (but still painful) scenario is that it has to raise new equity capital at a low price, thus permanently diluting shareholders. By replacing dilution, though, debt can be an extremely good tool for businesses that need capital to invest in growth at high rates of return. When we examine debt levels, we first consider both cash and debt levels, together.
View our latest analysis for Emova Group
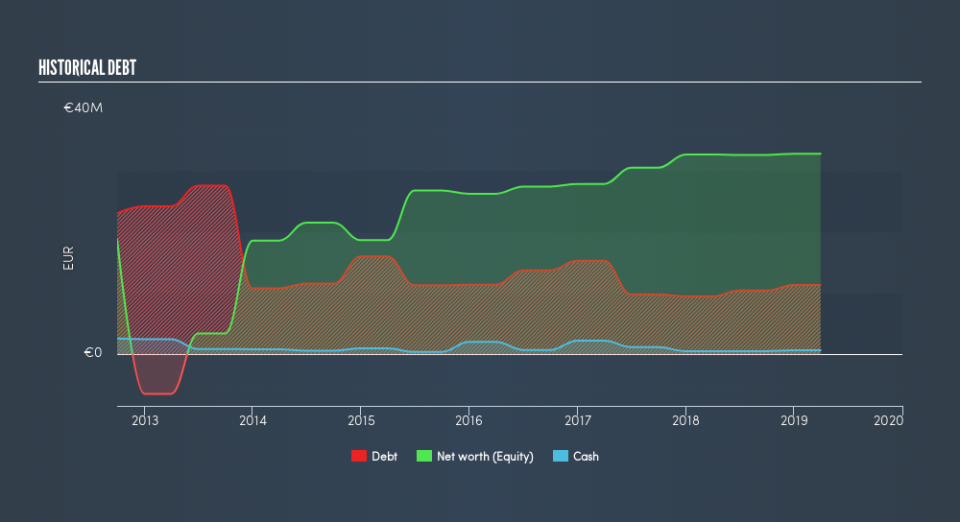
How Much Debt Does Emova Group Carry?
You can click the graphic below for the historical numbers, but it shows that as of March 2019 Emova Group had €11.3m of debt, an increase on €9.46m, over one year. However, it also had €635.0k in cash, and so its net debt is €10.7m.
How Healthy Is Emova Group's Balance Sheet?
According to the last reported balance sheet, Emova Group had liabilities of €21.2m due within 12 months, and liabilities of €10.2m due beyond 12 months. Offsetting this, it had €635.0k in cash and €11.4m in receivables that were due within 12 months. So it has liabilities totalling €19.4m more than its cash and near-term receivables, combined.
This deficit casts a shadow over the €12.1m company, like a colossus towering over mere mortals. So we definitely think shareholders need to watch this one closely. After all, Emova Group would likely require a major re-capitalisation if it had to pay its creditors today.
In order to size up a company's debt relative to its earnings, we calculate its net debt divided by its earnings before interest, tax, depreciation, and amortization (EBITDA) and its earnings before interest and tax (EBIT) divided by its interest expense (its interest cover). Thus we consider debt relative to earnings both with and without depreciation and amortization expenses.
Emova Group has a debt to EBITDA ratio of 4.7, which signals significant debt, but is still pretty reasonable for most types of business. But its EBIT was about 12.0 times its interest expense, implying the company isn't really paying full freight on that debt. Even if not sustainable, that is a good sign. Notably, Emova Group made a loss at the EBIT level, last year, but improved that to positive EBIT of €1.6m in the last twelve months. When analysing debt levels, the balance sheet is the obvious place to start. But you can't view debt in total isolation; since Emova Group will need earnings to service that debt. So if you're keen to discover more about its earnings, it might be worth checking out this graph of its long term earnings trend.
Finally, a company can only pay off debt with cold hard cash, not accounting profits. So it is important to check how much of its earnings before interest and tax (EBIT) converts to actual free cash flow. Over the last year, Emova Group reported free cash flow worth 3.3% of its EBIT, which is really quite low. That limp level of cash conversion undermines its ability to manage and pay down debt.
Our View
Mulling over Emova Group's attempt at staying on top of its total liabilities, we're certainly not enthusiastic. But on the bright side, its interest cover is a good sign, and makes us more optimistic. We're quite clear that we consider Emova Group to be really rather risky, as a result of its balance sheet health. For this reason we're pretty cautious about the stock, and we think shareholders should keep a close eye on its liquidity. Above most other metrics, we think its important to track how fast earnings per share is growing, if at all. If you've also come to that realization, you're in luck, because today you can view this interactive graph of Emova Group's earnings per share history for free.
At the end of the day, it's often better to focus on companies that are free from net debt. You can access our special list of such companies (all with a track record of profit growth). It's free.
We aim to bring you long-term focused research analysis driven by fundamental data. Note that our analysis may not factor in the latest price-sensitive company announcements or qualitative material.
If you spot an error that warrants correction, please contact the editor at editorial-team@simplywallst.com. This article by Simply Wall St is general in nature. It does not constitute a recommendation to buy or sell any stock, and does not take account of your objectives, or your financial situation. Simply Wall St has no position in the stocks mentioned. Thank you for reading.

