Is Empire Company Limited's (TSE:EMP.A) 9.1% ROE Better Than Average?

While some investors are already well versed in financial metrics (hat tip), this article is for those who would like to learn about Return On Equity (ROE) and why it is important. By way of learning-by-doing, we'll look at ROE to gain a better understanding of Empire Company Limited (TSE:EMP.A).
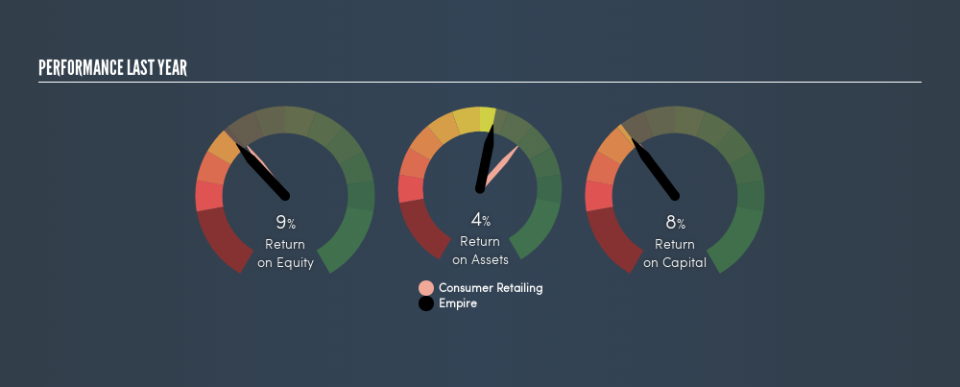
Over the last twelve months Empire has recorded a ROE of 9.1%. Another way to think of that is that for every CA$1 worth of equity in the company, it was able to earn CA$0.091.
Want to participate in a short research study? Help shape the future of investing tools and you could win a $250 gift card!
View our latest analysis for Empire
How Do I Calculate ROE?
The formula for ROE is:
Return on Equity = Net Profit ÷ Shareholders' Equity
Or for Empire:
9.1% = CA$336m ÷ CA$4.0b (Based on the trailing twelve months to February 2019.)
Most readers would understand what net profit is, but it’s worth explaining the concept of shareholders’ equity. It is all the money paid into the company from shareholders, plus any earnings retained. The easiest way to calculate shareholders' equity is to subtract the company's total liabilities from the total assets.
What Does ROE Mean?
Return on Equity measures a company's profitability against the profit it has kept for the business (plus any capital injections). The 'return' is the amount earned after tax over the last twelve months. The higher the ROE, the more profit the company is making. So, all else being equal, a high ROE is better than a low one. That means ROE can be used to compare two businesses.
Does Empire Have A Good ROE?
By comparing a company's ROE with its industry average, we can get a quick measure of how good it is. The limitation of this approach is that some companies are quite different from others, even within the same industry classification. If you look at the image below, you can see Empire has a similar ROE to the average in the Consumer Retailing industry classification (10%).
That's neither particularly good, nor bad. ROE can give us a view about company quality, but many investors also look to other factors, such as whether there are insiders buying shares. I will like Empire better if I see some big insider buys. While we wait, check out this free list of growing companies with considerable, recent, insider buying.
How Does Debt Impact Return On Equity?
Virtually all companies need money to invest in the business, to grow profits. The cash for investment can come from prior year profits (retained earnings), issuing new shares, or borrowing. In the first and second cases, the ROE will reflect this use of cash for investment in the business. In the latter case, the use of debt will improve the returns, but will not change the equity. In this manner the use of debt will boost ROE, even though the core economics of the business stay the same.
Empire's Debt And Its 9.1% ROE
Although Empire does use debt, its debt to equity ratio of 0.51 is still low. I'm not impressed with its ROE, but the debt levels are not too high, indicating the business has decent prospects. Conservative use of debt to boost returns is usually a good move for shareholders, though it does leave the company more exposed to interest rate rises.
The Bottom Line On ROE
Return on equity is useful for comparing the quality of different businesses. A company that can achieve a high return on equity without debt could be considered a high quality business. If two companies have the same ROE, then I would generally prefer the one with less debt.
Having said that, while ROE is a useful indicator of business quality, you'll have to look at a whole range of factors to determine the right price to buy a stock. It is important to consider other factors, such as future profit growth -- and how much investment is required going forward. So you might want to check this FREE visualization of analyst forecasts for the company.
Of course, you might find a fantastic investment by looking elsewhere. So take a peek at this free list of interesting companies.
We aim to bring you long-term focused research analysis driven by fundamental data. Note that our analysis may not factor in the latest price-sensitive company announcements or qualitative material.
If you spot an error that warrants correction, please contact the editor at editorial-team@simplywallst.com. This article by Simply Wall St is general in nature. It does not constitute a recommendation to buy or sell any stock, and does not take account of your objectives, or your financial situation. Simply Wall St has no position in the stocks mentioned. Thank you for reading.

