What Is Energy Recovery's (NASDAQ:ERII) P/E Ratio After Its Share Price Tanked?

Unfortunately for some shareholders, the Energy Recovery (NASDAQ:ERII) share price has dived 31% in the last thirty days. Even longer term holders have taken a real hit with the stock declining 23% in the last year.
Assuming nothing else has changed, a lower share price makes a stock more attractive to potential buyers. In the long term, share prices tend to follow earnings per share, but in the short term prices bounce around in response to short term factors (which are not always obvious). So, on certain occasions, long term focussed investors try to take advantage of pessimistic expectations to buy shares at a better price. One way to gauge market expectations of a stock is to look at its Price to Earnings Ratio (PE Ratio). A high P/E ratio means that investors have a high expectation about future growth, while a low P/E ratio means they have low expectations about future growth.
View our latest analysis for Energy Recovery
How Does Energy Recovery's P/E Ratio Compare To Its Peers?
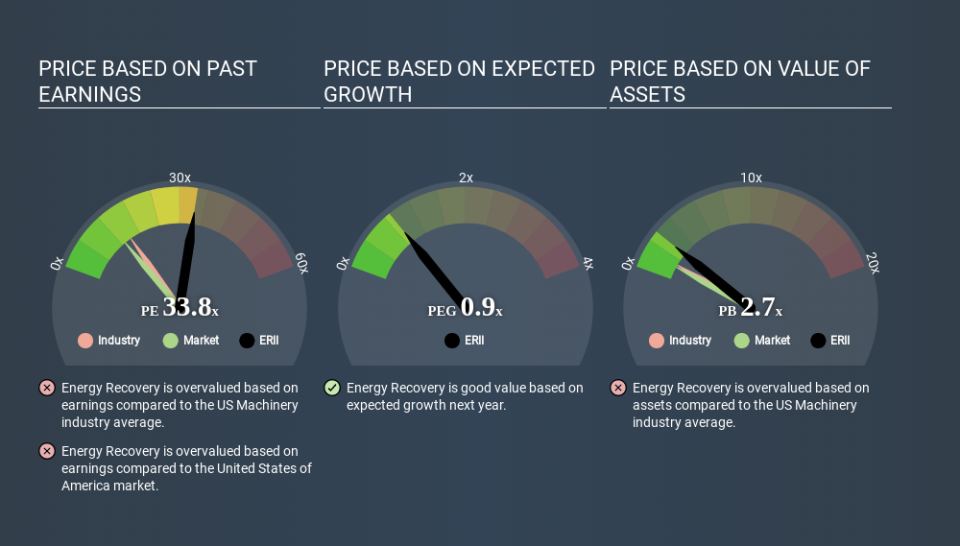
Energy Recovery's P/E of 33.76 indicates some degree of optimism towards the stock. As you can see below, Energy Recovery has a higher P/E than the average company (15.0) in the machinery industry.
Its relatively high P/E ratio indicates that Energy Recovery shareholders think it will perform better than other companies in its industry classification. Clearly the market expects growth, but it isn't guaranteed. So investors should always consider the P/E ratio alongside other factors, such as whether company directors have been buying shares.
How Growth Rates Impact P/E Ratios
Probably the most important factor in determining what P/E a company trades on is the earnings growth. If earnings are growing quickly, then the 'E' in the equation will increase faster than it would otherwise. And in that case, the P/E ratio itself will drop rather quickly. So while a stock may look expensive based on past earnings, it could be cheap based on future earnings.
Energy Recovery shrunk earnings per share by 51% over the last year. But EPS is up 41% over the last 3 years.
Remember: P/E Ratios Don't Consider The Balance Sheet
It's important to note that the P/E ratio considers the market capitalization, not the enterprise value. That means it doesn't take debt or cash into account. Theoretically, a business can improve its earnings (and produce a lower P/E in the future) by investing in growth. That means taking on debt (or spending its cash).
Such spending might be good or bad, overall, but the key point here is that you need to look at debt to understand the P/E ratio in context.
Energy Recovery's Balance Sheet
With net cash of US$85m, Energy Recovery has a very strong balance sheet, which may be important for its business. Having said that, at 23% of its market capitalization the cash hoard would contribute towards a higher P/E ratio.
The Verdict On Energy Recovery's P/E Ratio
Energy Recovery trades on a P/E ratio of 33.8, which is above its market average of 13.0. The recent drop in earnings per share would make some investors cautious, but the relatively strong balance sheet will allow the company time to invest in growth. Clearly, the high P/E indicates shareholders think it will! What can be absolutely certain is that the market has become significantly less optimistic about Energy Recovery over the last month, with the P/E ratio falling from 49.2 back then to 33.8 today. For those who prefer to invest with the flow of momentum, that might be a bad sign, but for a contrarian, it may signal opportunity.
When the market is wrong about a stock, it gives savvy investors an opportunity. If the reality for a company is better than it expects, you can make money by buying and holding for the long term. So this free visual report on analyst forecasts could hold the key to an excellent investment decision.
But note: Energy Recovery may not be the best stock to buy. So take a peek at this free list of interesting companies with strong recent earnings growth (and a P/E ratio below 20).
If you spot an error that warrants correction, please contact the editor at editorial-team@simplywallst.com. This article by Simply Wall St is general in nature. It does not constitute a recommendation to buy or sell any stock, and does not take account of your objectives, or your financial situation. Simply Wall St has no position in the stocks mentioned.
We aim to bring you long-term focused research analysis driven by fundamental data. Note that our analysis may not factor in the latest price-sensitive company announcements or qualitative material. Thank you for reading.

