Do You Like EnGro Corporation Limited (SGX:S44) At This P/E Ratio?

Today, we'll introduce the concept of the P/E ratio for those who are learning about investing. To keep it practical, we'll show how EnGro Corporation Limited's (SGX:S44) P/E ratio could help you assess the value on offer. What is EnGro's P/E ratio? Well, based on the last twelve months it is 15.14. That means that at current prices, buyers pay SGD15.14 for every SGD1 in trailing yearly profits.
Check out our latest analysis for EnGro
How Do You Calculate A P/E Ratio?
The formula for P/E is:
Price to Earnings Ratio = Share Price ÷ Earnings per Share (EPS)
Or for EnGro:
P/E of 15.14 = SGD0.99 ÷ SGD0.066 (Based on the trailing twelve months to June 2019.)
Is A High P/E Ratio Good?
The higher the P/E ratio, the higher the price tag of a business, relative to its trailing earnings. That isn't necessarily good or bad, but a high P/E implies relatively high expectations of what a company can achieve in the future.
Does EnGro Have A Relatively High Or Low P/E For Its Industry?
The P/E ratio essentially measures market expectations of a company. The image below shows that EnGro has a lower P/E than the average (16.4) P/E for companies in the basic materials industry.
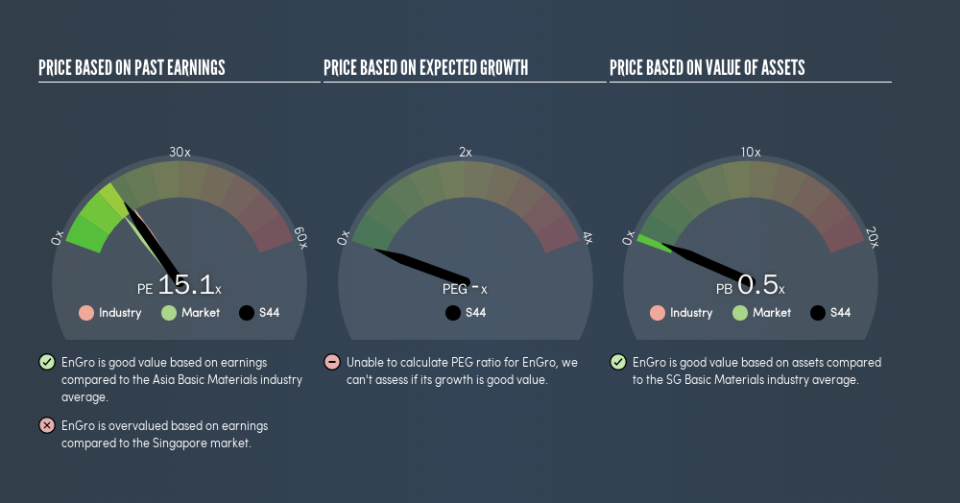
This suggests that market participants think EnGro will underperform other companies in its industry. Since the market seems unimpressed with EnGro, it's quite possible it could surprise on the upside. You should delve deeper. I like to check if company insiders have been buying or selling.
How Growth Rates Impact P/E Ratios
Generally speaking the rate of earnings growth has a profound impact on a company's P/E multiple. If earnings are growing quickly, then the 'E' in the equation will increase faster than it would otherwise. That means unless the share price increases, the P/E will reduce in a few years. And as that P/E ratio drops, the company will look cheap, unless its share price increases.
EnGro increased earnings per share by 7.2% last year. In contrast, EPS has decreased by 10%, annually, over 5 years.
A Limitation: P/E Ratios Ignore Debt and Cash In The Bank
One drawback of using a P/E ratio is that it considers market capitalization, but not the balance sheet. In other words, it does not consider any debt or cash that the company may have on the balance sheet. Theoretically, a business can improve its earnings (and produce a lower P/E in the future) by investing in growth. That means taking on debt (or spending its cash).
Such spending might be good or bad, overall, but the key point here is that you need to look at debt to understand the P/E ratio in context.
How Does EnGro's Debt Impact Its P/E Ratio?
With net cash of S$41m, EnGro has a very strong balance sheet, which may be important for its business. Having said that, at 37% of its market capitalization the cash hoard would contribute towards a higher P/E ratio.
The Bottom Line On EnGro's P/E Ratio
EnGro has a P/E of 15.1. That's higher than the average in its market, which is 12.9. EPS was up modestly better over the last twelve months. And the net cash position provides the company with multiple options. The high P/E suggests the market thinks further growth will come.
Investors have an opportunity when market expectations about a stock are wrong. If the reality for a company is better than it expects, you can make money by buying and holding for the long term. We don't have analyst forecasts, but you could get a better understanding of its growth by checking out this more detailed historical graph of earnings, revenue and cash flow.
Of course, you might find a fantastic investment by looking at a few good candidates. So take a peek at this free list of companies with modest (or no) debt, trading on a P/E below 20.
We aim to bring you long-term focused research analysis driven by fundamental data. Note that our analysis may not factor in the latest price-sensitive company announcements or qualitative material.
If you spot an error that warrants correction, please contact the editor at editorial-team@simplywallst.com. This article by Simply Wall St is general in nature. It does not constitute a recommendation to buy or sell any stock, and does not take account of your objectives, or your financial situation. Simply Wall St has no position in the stocks mentioned. Thank you for reading.

