Is IT Link (EPA:ITL) A Risky Investment?

David Iben put it well when he said, 'Volatility is not a risk we care about. What we care about is avoiding the permanent loss of capital. It's only natural to consider a company's balance sheet when you examine how risky it is, since debt is often involved when a business collapses. We note that IT Link SA (EPA:ITL) does have debt on its balance sheet. But should shareholders be worried about its use of debt?
When Is Debt A Problem?
Generally speaking, debt only becomes a real problem when a company can't easily pay it off, either by raising capital or with its own cash flow. Part and parcel of capitalism is the process of 'creative destruction' where failed businesses are mercilessly liquidated by their bankers. However, a more frequent (but still costly) occurrence is where a company must issue shares at bargain-basement prices, permanently diluting shareholders, just to shore up its balance sheet. By replacing dilution, though, debt can be an extremely good tool for businesses that need capital to invest in growth at high rates of return. The first thing to do when considering how much debt a business uses is to look at its cash and debt together.
View our latest analysis for IT Link
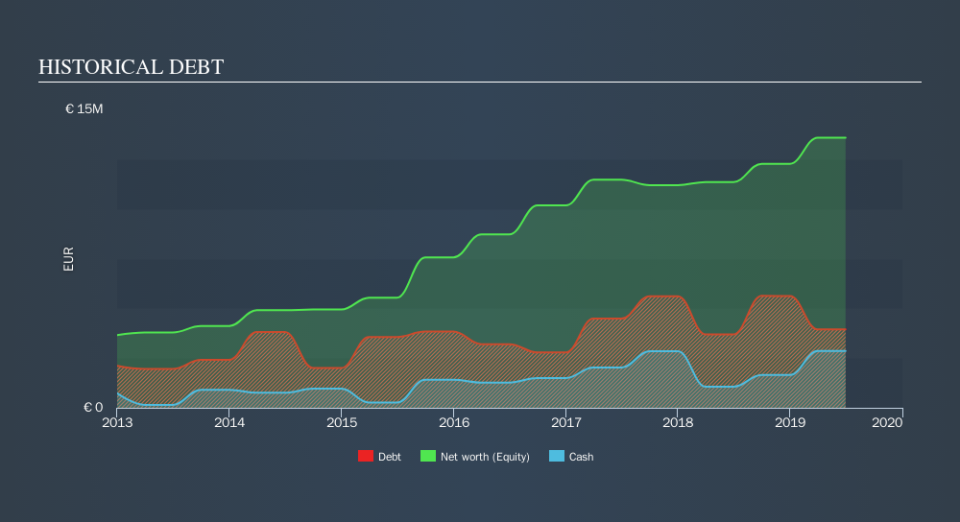
What Is IT Link's Debt?
You can click the graphic below for the historical numbers, but it shows that as of June 2019 IT Link had €3.94m of debt, an increase on €3.69m, over one year. However, it also had €2.85m in cash, and so its net debt is €1.09m.
A Look At IT Link's Liabilities
We can see from the most recent balance sheet that IT Link had liabilities of €19.9m falling due within a year, and liabilities of €6.36m due beyond that. Offsetting these obligations, it had cash of €2.85m as well as receivables valued at €27.4m due within 12 months. So it actually has €4.07m more liquid assets than total liabilities.
This surplus suggests that IT Link is using debt in a way that is appears to be both safe and conservative. Due to its strong net asset position, it is not likely to face issues with its lenders.
We use two main ratios to inform us about debt levels relative to earnings. The first is net debt divided by earnings before interest, tax, depreciation, and amortization (EBITDA), while the second is how many times its earnings before interest and tax (EBIT) covers its interest expense (or its interest cover, for short). This way, we consider both the absolute quantum of the debt, as well as the interest rates paid on it.
IT Link has a low net debt to EBITDA ratio of only 0.34. And its EBIT covers its interest expense a whopping 26.1 times over. So we're pretty relaxed about its super-conservative use of debt. Better yet, IT Link grew its EBIT by 122% last year, which is an impressive improvement. That boost will make it even easier to pay down debt going forward. When analysing debt levels, the balance sheet is the obvious place to start. But ultimately the future profitability of the business will decide if IT Link can strengthen its balance sheet over time. So if you're focused on the future you can check out this free report showing analyst profit forecasts.
Finally, a company can only pay off debt with cold hard cash, not accounting profits. So it's worth checking how much of that EBIT is backed by free cash flow. Looking at the most recent three years, IT Link recorded free cash flow of 27% of its EBIT, which is weaker than we'd expect. That weak cash conversion makes it more difficult to handle indebtedness.
Our View
Happily, IT Link's impressive interest cover implies it has the upper hand on its debt. But truth be told we feel its conversion of EBIT to free cash flow does undermine this impression a bit. Zooming out, IT Link seems to use debt quite reasonably; and that gets the nod from us. While debt does bring risk, when used wisely it can also bring a higher return on equity. Over time, share prices tend to follow earnings per share, so if you're interested in IT Link, you may well want to click here to check an interactive graph of its earnings per share history.
If you're interested in investing in businesses that can grow profits without the burden of debt, then check out this free list of growing businesses that have net cash on the balance sheet.
We aim to bring you long-term focused research analysis driven by fundamental data. Note that our analysis may not factor in the latest price-sensitive company announcements or qualitative material.
If you spot an error that warrants correction, please contact the editor at editorial-team@simplywallst.com. This article by Simply Wall St is general in nature. It does not constitute a recommendation to buy or sell any stock, and does not take account of your objectives, or your financial situation. Simply Wall St has no position in the stocks mentioned. Thank you for reading.
