What Is Equals Group's (LON:EQLS) P/E Ratio After Its Share Price Tanked?

Unfortunately for some shareholders, the Equals Group (LON:EQLS) share price has dived 37% in the last thirty days. Indeed the recent decline has arguably caused some bitterness for shareholders who have held through the 41% drop over twelve months.
Assuming nothing else has changed, a lower share price makes a stock more attractive to potential buyers. In the long term, share prices tend to follow earnings per share, but in the short term prices bounce around in response to short term factors (which are not always obvious). So, on certain occasions, long term focussed investors try to take advantage of pessimistic expectations to buy shares at a better price. One way to gauge market expectations of a stock is to look at its Price to Earnings Ratio (PE Ratio). Investors have optimistic expectations of companies with higher P/E ratios, compared to companies with lower P/E ratios.
Check out our latest analysis for Equals Group
Does Equals Group Have A Relatively High Or Low P/E For Its Industry?
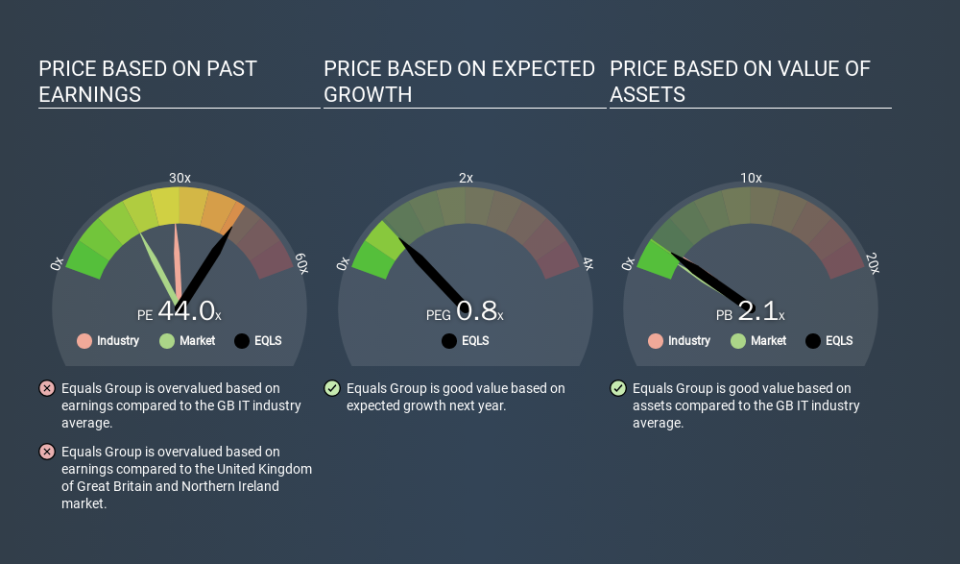
Equals Group's P/E of 44.02 indicates some degree of optimism towards the stock. As you can see below, Equals Group has a higher P/E than the average company (29.0) in the it industry.
Equals Group's P/E tells us that market participants think the company will perform better than its industry peers, going forward. Shareholders are clearly optimistic, but the future is always uncertain. So investors should always consider the P/E ratio alongside other factors, such as whether company directors have been buying shares.
How Growth Rates Impact P/E Ratios
Probably the most important factor in determining what P/E a company trades on is the earnings growth. When earnings grow, the 'E' increases, over time. And in that case, the P/E ratio itself will drop rather quickly. A lower P/E should indicate the stock is cheap relative to others -- and that may attract buyers.
Equals Group shrunk earnings per share by 25% over the last year.
A Limitation: P/E Ratios Ignore Debt and Cash In The Bank
Don't forget that the P/E ratio considers market capitalization. Thus, the metric does not reflect cash or debt held by the company. In theory, a company can lower its future P/E ratio by using cash or debt to invest in growth.
Spending on growth might be good or bad a few years later, but the point is that the P/E ratio does not account for the option (or lack thereof).
So What Does Equals Group's Balance Sheet Tell Us?
Equals Group has net cash of UK£4.8m. That should lead to a higher P/E than if it did have debt, because its strong balance sheets gives it more options.
The Bottom Line On Equals Group's P/E Ratio
Equals Group's P/E is 44.0 which is above average (18.2) in its market. Falling earnings per share is probably keeping traditional value investors away, but the relatively strong balance sheet will allow the company time to invest in growth. Clearly, the high P/E indicates shareholders think it will! What can be absolutely certain is that the market has become significantly less optimistic about Equals Group over the last month, with the P/E ratio falling from 70.3 back then to 44.0 today. For those who prefer to invest with the flow of momentum, that might be a bad sign, but for a contrarian, it may signal opportunity.
Investors have an opportunity when market expectations about a stock are wrong. If the reality for a company is better than it expects, you can make money by buying and holding for the long term. So this free visualization of the analyst consensus on future earnings could help you make the right decision about whether to buy, sell, or hold.
You might be able to find a better buy than Equals Group. If you want a selection of possible winners, check out this free list of interesting companies that trade on a P/E below 20 (but have proven they can grow earnings).
If you spot an error that warrants correction, please contact the editor at editorial-team@simplywallst.com. This article by Simply Wall St is general in nature. It does not constitute a recommendation to buy or sell any stock, and does not take account of your objectives, or your financial situation. Simply Wall St has no position in the stocks mentioned.
We aim to bring you long-term focused research analysis driven by fundamental data. Note that our analysis may not factor in the latest price-sensitive company announcements or qualitative material. Thank you for reading.

