Ethereum Classic: Latest Price Analysis
The majority of the cryptocurrency market is back in the green today after recovering from Amazon’s rejection of the rumours surrounding its crypto intentions.
Bitcoin is up 7.32%, while Ethereum has seen a much more modest increase of 3.65%. Terra (LUNA) is one of the best performing assets over the last 24; rising 10.38%.
ETC currently ranks at number 18 on CoinMarketCap with a circulating market cap of $6.207B.
Ethereum Classic recent price action
ETC experienced a rapid price surge over the last few days. The asset rose from $46 to $55.80 – an increase of just over 21%. It then saw a violent breakdown back down to the $46 support area.
Last week saw the first bullish signal for the currency when the Moving Averages (MAs) signalled a bullish crossover. This is where the shorter term 50 period MA crossed the longer-term MA to the upside. Price continued to make higher highs and higher lows for the next week.
Fuelled by BTCs price surge to $40,000, based on rumours that Amazon were looking at BTC as a payment method, ETC also experienced a rapid price surge to $55.81.
However soon after Amazon rejected these claims, BTC fell, taking down ETC and the wider market with it. ETC dropped around 17% to find support back at the $46 area again.
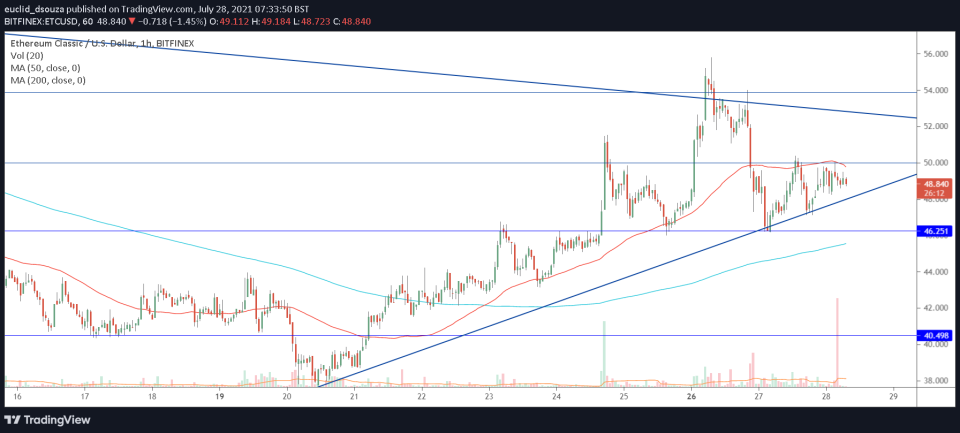
ETC/USD price chart by TradingView
ETC/USD 4-hour chart: the end of the upside?
On the four-hour chart, we can see the ETC price failing to make higher lows as it broke through the $50 support turning it back into resistance. Furthermore, it is clear to see a head and shoulders pattern forming which is typically a bearish price action pattern.
If the price breaks this neckline support at $46, then ETC can be expected to reach its next critical support around $40. To further support this bearish bias, the shorter-term MA is still below the longer-term MA.
However, it is also interesting to note that the RSI indicator is providing a conflicting divergence signal. While price found support at the $46 area again, the RSI indicator fell much lower creating a lower low.
Whilst this is a weak divergence signal, it could indicate that ETC still has some more momentum to give a final push back to the upside.
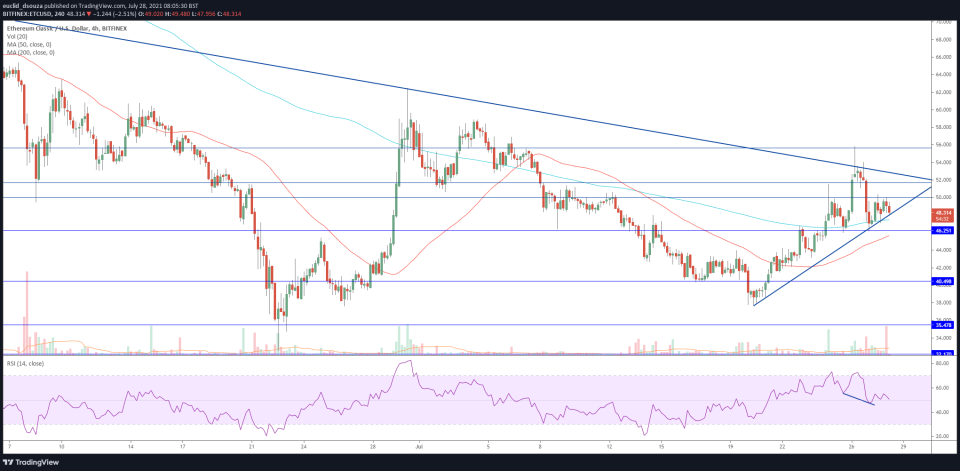
ETC/USD price chart by TradingView
Conclusion
Ethereum Classic now lies in a critical state. A successful break above the $52 resistance and the long term trend line means that ETC could once again resume its movements back to the upside. However, if the $46 support area does not hold, then ETC will break rapidly back down towards the downside, completing the head and shoulders pattern.

