Should Eumundi Group Limited (ASX:EBG) Be Part Of Your Income Portfolio?

Dividend paying stocks like Eumundi Group Limited (ASX:EBG) tend to be popular with investors, and for good reason - some research suggests a significant amount of all stock market returns come from reinvested dividends. Unfortunately, it's common for investors to be enticed in by the seemingly attractive yield, and lose money when the company has to cut its dividend payments.
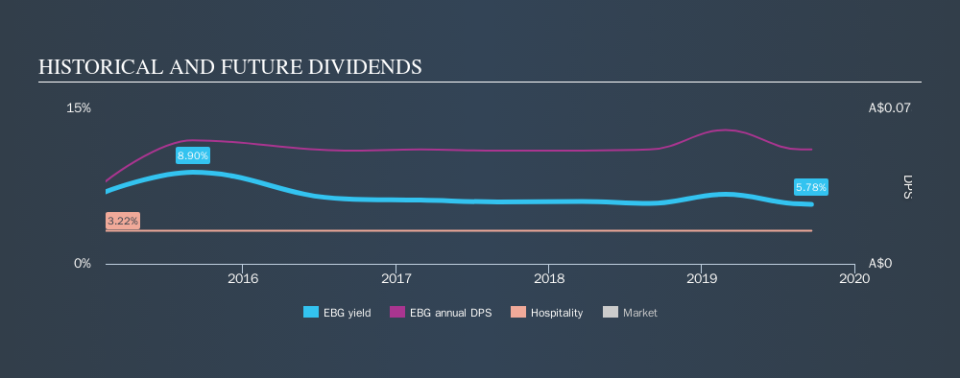
In this case, Eumundi Group likely looks attractive to dividend investors, given its 5.8% dividend yield and five-year payment history. It sure looks interesting on these metrics - but there's always more to the story . Some simple research can reduce the risk of buying Eumundi Group for its dividend - read on to learn more.
Click the interactive chart for our full dividend analysis
Payout ratios
Dividends are typically paid from company earnings. If a company pays more in dividends than it earned, then the dividend might become unsustainable - hardly an ideal situation. So we need to form a view on if a company's dividend is sustainable, relative to its net profit after tax. Eumundi Group paid out 107% of its profit as dividends, over the trailing twelve month period. A payout ratio above 100% is definitely an item of concern, unless there are some other circumstances that would justify it.
Another important check we do is to see if the free cash flow generated is sufficient to pay the dividend. Unfortunately, while Eumundi Group pays a dividend, it also reported negative free cash flow last year. While there may be a good reason for this, it's not ideal from a dividend perspective.
Is Eumundi Group's Balance Sheet Risky?
As Eumundi Group's dividend was not well covered by earnings, we need to check its balance sheet for signs of financial distress. A quick check of its financial situation can be done with two ratios: net debt divided by EBITDA (earnings before interest, tax, depreciation and amortisation), and net interest cover. Net debt to EBITDA is a measure of a company's total debt. Net interest cover measures the ability to meet interest payments. Essentially we check that a) the company does not have too much debt, and b) that it can afford to pay the interest. Eumundi Group has net debt of 5.36 times its EBITDA, which implies meaningful risk if interest rates rise of earnings decline.
We calculated its interest cover by measuring its earnings before interest and tax (EBIT), and dividing this by the company's net interest expense. Interest cover of 3.72 times its interest expense is starting to become a concern for Eumundi Group, and be aware that lenders may place additional restrictions on the company as well. Low interest cover and high debt can create problems right when the investor least needs them, and we're reluctant to rely on the dividend of companies with these traits.
Remember, you can always get a snapshot of Eumundi Group's latest financial position, by checking our visualisation of its financial health.
Dividend Volatility
One of the major risks of relying on dividend income, is the potential for a company to struggle financially and cut its dividend. Not only is your income cut, but the value of your investment declines as well - nasty. Looking at the data, we can see that Eumundi Group has been paying a dividend for the past five years. During the past five-year period, the first annual payment was AU$0.04 in 2014, compared to AU$0.056 last year. Dividends per share have grown at approximately 6.8% per year over this time. Eumundi Group's dividend payments have fluctuated, so it hasn't grown 6.8% every year, but the CAGR is a useful rule of thumb for approximating the historical growth.
A reasonable rate of dividend growth is good to see, but we're wary that the dividend history is not as solid as we'd like, having been cut at least once.
Dividend Growth Potential
Given that the dividend has been cut in the past, we need to check if earnings are growing and if that might lead to stronger dividends in the future. Eumundi Group's EPS have fallen by approximately 18% per year. A sharp decline in earnings per share is not great from from a dividend perspective, as even conservative payout ratios can come under pressure if earnings fall far enough.
Conclusion
To summarise, shareholders should always check that Eumundi Group's dividends are affordable, that its dividend payments are relatively stable, and that it has decent prospects for growing its earnings and dividend. We're a bit uncomfortable with Eumundi Group paying out a high percentage of both its cashflow and earnings. Earnings per share are down, and Eumundi Group's dividend has been cut at least once in the past, which is disappointing. Using these criteria, Eumundi Group looks quite suboptimal from a dividend investment perspective.
Now, if you want to look closer, it would be worth checking out our free research on Eumundi Group management tenure, salary, and performance.
Looking for more high-yielding dividend ideas? Try our curated list of dividend stocks with a yield above 3%.
We aim to bring you long-term focused research analysis driven by fundamental data. Note that our analysis may not factor in the latest price-sensitive company announcements or qualitative material.
If you spot an error that warrants correction, please contact the editor at editorial-team@simplywallst.com. This article by Simply Wall St is general in nature. It does not constitute a recommendation to buy or sell any stock, and does not take account of your objectives, or your financial situation. Simply Wall St has no position in the stocks mentioned. Thank you for reading.
