EUR/USD Mid-Session Technical Analysis for April 10, 2020
The Euro is trading flat to higher against U.S. Dollar on low volume on Friday. Banks are closed all around the world due to Good Friday, so activity has been limited.
The single-currency is being underpinned by a weaker U.S. Dollar. The dollar was on course for a weekly loss on Friday as the U.S. Federal Reserve’s massive new lending program for small companies and signs of a slowdown in coronavirus infections reduced safe-haven demand.
At 13:13 GMT, the EUR/USD is trading 1.0944, up 0.0011 or +0.10%.
Daily Technical Analysis
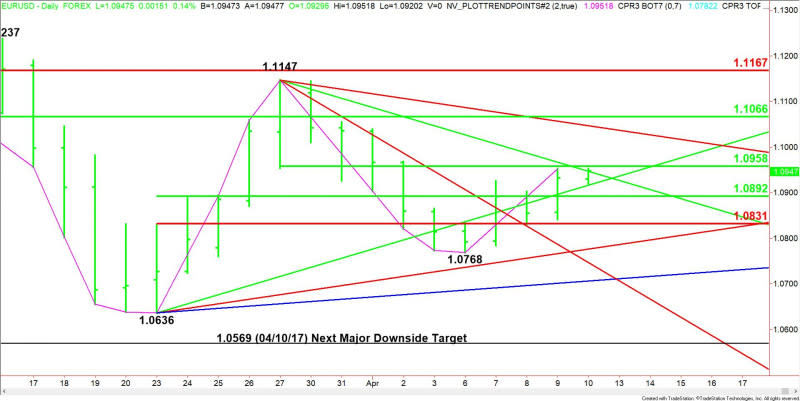
The main trend is down according to the daily swing chart. A trade through 1.0768 will signal a resumption of the downtrend. The main trend will change to up on a trade through the last main top at 1.1147.
The short-term range is 1.1147 to 1.0768. Its 50% level or pivot at 1.0958 is resistance. This level stopped the rally on Thursday and Friday.
The main range is 1.0636 to 1.1147. Its retracement zone at 1.0892 to 1.0831 is new support. Holding above this zone is helping to generate a slight upside bias.
Short-Term Outlook
The EUR/USD is currently trading inside a triangle formation. The top of the triangle is a downtrending Gann angle at 1.0947. The bottom of the triangle is 1.0916.
The triangle at 1.0916 to 1.0947 is trading between a pair of 50% levels at 1.0958 and 1.0892.
This type of chart pattern indicates impending volatility and a potential breakout.
Bullish Scenario
A breakout over 1.0958 will indicate the presence of buyers. If this is able to generate enough upside momentum then look for a surge into the next downtrending Gann angle at 1.1047, followed by a major 50% level at 1.1066.
Bearish Scenario
A sustained move under 1.0892 will signal the presence of sellers. This could trigger a break into the main Fibonacci level at 1.0831. If this fails then look for the selling to possible extend into the uptrending Gann angle at 1.0776, followed by the main bottom at 1.0768.
Side Notes
The chart pattern indicates that the EUR/USD is set up for a volatile breakout. It’s come to the Apex of the triangle so it has to start making its move. The key to success when trading a breakout is big volume.
Everyone sees the pattern, but not everyone sees the buying or selling volume. Those who do have the edge, which is why the professionals win most of the time. Don’t play the breakout unless you have buying or selling volume on your side.
This article was originally posted on FX Empire

