Evaluating Brunello Cucinelli S.p.A.’s (BIT:BC) Investments In Its Business

Today we'll look at Brunello Cucinelli S.p.A. (BIT:BC) and reflect on its potential as an investment. Specifically, we'll consider its Return On Capital Employed (ROCE), since that will give us an insight into how efficiently the business can generate profits from the capital it requires.
First up, we'll look at what ROCE is and how we calculate it. Second, we'll look at its ROCE compared to similar companies. Finally, we'll look at how its current liabilities affect its ROCE.
What is Return On Capital Employed (ROCE)?
ROCE measures the amount of pre-tax profits a company can generate from the capital employed in its business. In general, businesses with a higher ROCE are usually better quality. In brief, it is a useful tool, but it is not without drawbacks. Author Edwin Whiting says to be careful when comparing the ROCE of different businesses, since 'No two businesses are exactly alike.
So, How Do We Calculate ROCE?
The formula for calculating the return on capital employed is:
Return on Capital Employed = Earnings Before Interest and Tax (EBIT) ÷ (Total Assets - Current Liabilities)
Or for Brunello Cucinelli:
0.11 = €74m ÷ (€903m - €243m) (Based on the trailing twelve months to June 2019.)
So, Brunello Cucinelli has an ROCE of 11%.
View our latest analysis for Brunello Cucinelli
Is Brunello Cucinelli's ROCE Good?
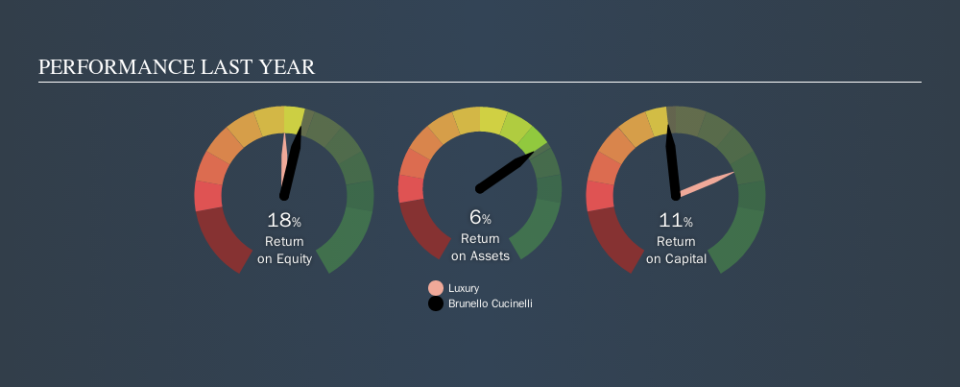
One way to assess ROCE is to compare similar companies. It appears that Brunello Cucinelli's ROCE is fairly close to the Luxury industry average of 11%. Independently of how Brunello Cucinelli compares to its industry, its ROCE in absolute terms appears decent, and the company may be worthy of closer investigation.
Brunello Cucinelli's current ROCE of 11% is lower than 3 years ago, when the company reported a 20% ROCE. This makes us wonder if the business is facing new challenges. The image below shows how Brunello Cucinelli's ROCE compares to its industry, and you can click it to see more detail on its past growth.
When considering ROCE, bear in mind that it reflects the past and does not necessarily predict the future. Companies in cyclical industries can be difficult to understand using ROCE, as returns typically look high during boom times, and low during busts. ROCE is, after all, simply a snap shot of a single year. Since the future is so important for investors, you should check out our free report on analyst forecasts for Brunello Cucinelli.
Brunello Cucinelli's Current Liabilities And Their Impact On Its ROCE
Short term (or current) liabilities, are things like supplier invoices, overdrafts, or tax bills that need to be paid within 12 months. The ROCE equation subtracts current liabilities from capital employed, so a company with a lot of current liabilities appears to have less capital employed, and a higher ROCE than otherwise. To counter this, investors can check if a company has high current liabilities relative to total assets.
Brunello Cucinelli has total liabilities of €243m and total assets of €903m. As a result, its current liabilities are equal to approximately 27% of its total assets. Current liabilities are minimal, limiting the impact on ROCE.
What We Can Learn From Brunello Cucinelli's ROCE
This is good to see, and with a sound ROCE, Brunello Cucinelli could be worth a closer look. Brunello Cucinelli looks strong on this analysis, but there are plenty of other companies that could be a good opportunity . Here is a free list of companies growing earnings rapidly.
If you are like me, then you will not want to miss this free list of growing companies that insiders are buying.
We aim to bring you long-term focused research analysis driven by fundamental data. Note that our analysis may not factor in the latest price-sensitive company announcements or qualitative material.
If you spot an error that warrants correction, please contact the editor at editorial-team@simplywallst.com. This article by Simply Wall St is general in nature. It does not constitute a recommendation to buy or sell any stock, and does not take account of your objectives, or your financial situation. Simply Wall St has no position in the stocks mentioned. Thank you for reading.
