Evaluating eClerx Services Limited’s (NSE:ECLERX) Investments In Its Business

Today we are going to look at eClerx Services Limited (NSE:ECLERX) to see whether it might be an attractive investment prospect. Specifically, we're going to calculate its Return On Capital Employed (ROCE), in the hopes of getting some insight into the business.
First, we'll go over how we calculate ROCE. Second, we'll look at its ROCE compared to similar companies. And finally, we'll look at how its current liabilities are impacting its ROCE.
What is Return On Capital Employed (ROCE)?
ROCE measures the amount of pre-tax profits a company can generate from the capital employed in its business. All else being equal, a better business will have a higher ROCE. Overall, it is a valuable metric that has its flaws. Author Edwin Whiting says to be careful when comparing the ROCE of different businesses, since 'No two businesses are exactly alike.
So, How Do We Calculate ROCE?
The formula for calculating the return on capital employed is:
Return on Capital Employed = Earnings Before Interest and Tax (EBIT) ÷ (Total Assets - Current Liabilities)
Or for eClerx Services:
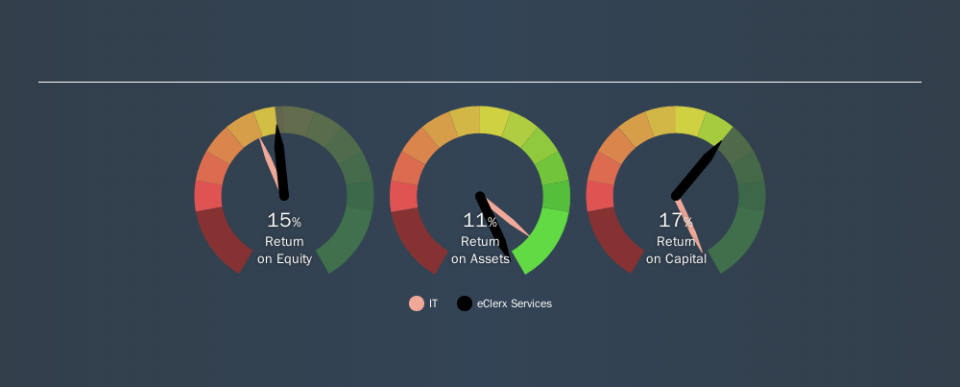
0.17 = ₹2.4b ÷ (₹16b - ₹1.5b) (Based on the trailing twelve months to June 2019.)
So, eClerx Services has an ROCE of 17%.
View our latest analysis for eClerx Services
Does eClerx Services Have A Good ROCE?
ROCE is commonly used for comparing the performance of similar businesses. We can see eClerx Services's ROCE is around the 14% average reported by the IT industry. Separate from eClerx Services's performance relative to its industry, its ROCE in absolute terms looks satisfactory, and it may be worth researching in more depth.
eClerx Services's current ROCE of 17% is lower than 3 years ago, when the company reported a 40% ROCE. Therefore we wonder if the company is facing new headwinds. You can click on the image below to see (in greater detail) how eClerx Services's past growth compares to other companies.
Remember that this metric is backwards looking - it shows what has happened in the past, and does not accurately predict the future. ROCE can be misleading for companies in cyclical industries, with returns looking impressive during the boom times, but very weak during the busts. ROCE is only a point-in-time measure. Future performance is what matters, and you can see analyst predictions in our free report on analyst forecasts for the company.
eClerx Services's Current Liabilities And Their Impact On Its ROCE
Current liabilities include invoices, such as supplier payments, short-term debt, or a tax bill, that need to be paid within 12 months. Due to the way the ROCE equation works, having large bills due in the near term can make it look as though a company has less capital employed, and thus a higher ROCE than usual. To counteract this, we check if a company has high current liabilities, relative to its total assets.
eClerx Services has total assets of ₹16b and current liabilities of ₹1.5b. As a result, its current liabilities are equal to approximately 9.3% of its total assets. Low current liabilities have only a minimal impact on eClerx Services's ROCE, making its decent returns more credible.
What We Can Learn From eClerx Services's ROCE
This is good to see, and while better prospects may exist, eClerx Services seems worth researching further. eClerx Services looks strong on this analysis, but there are plenty of other companies that could be a good opportunity . Here is a free list of companies growing earnings rapidly.
For those who like to find winning investments this free list of growing companies with recent insider purchasing, could be just the ticket.
We aim to bring you long-term focused research analysis driven by fundamental data. Note that our analysis may not factor in the latest price-sensitive company announcements or qualitative material.
If you spot an error that warrants correction, please contact the editor at editorial-team@simplywallst.com. This article by Simply Wall St is general in nature. It does not constitute a recommendation to buy or sell any stock, and does not take account of your objectives, or your financial situation. Simply Wall St has no position in the stocks mentioned. Thank you for reading.
