Evaluating Rama Steel Tubes Limited’s (NSE:RAMASTEEL) Investments In Its Business

Want to participate in a short research study? Help shape the future of investing tools and you could win a $250 gift card!
Today we'll look at Rama Steel Tubes Limited (NSE:RAMASTEEL) and reflect on its potential as an investment. Specifically, we're going to calculate its Return On Capital Employed (ROCE), in the hopes of getting some insight into the business.
First, we'll go over how we calculate ROCE. Second, we'll look at its ROCE compared to similar companies. And finally, we'll look at how its current liabilities are impacting its ROCE.
Return On Capital Employed (ROCE): What is it?
ROCE measures the amount of pre-tax profits a company can generate from the capital employed in its business. Generally speaking a higher ROCE is better. In brief, it is a useful tool, but it is not without drawbacks. Renowned investment researcher Michael Mauboussin has suggested that a high ROCE can indicate that 'one dollar invested in the company generates value of more than one dollar'.
How Do You Calculate Return On Capital Employed?
Analysts use this formula to calculate return on capital employed:
Return on Capital Employed = Earnings Before Interest and Tax (EBIT) ÷ (Total Assets - Current Liabilities)
Or for Rama Steel Tubes:
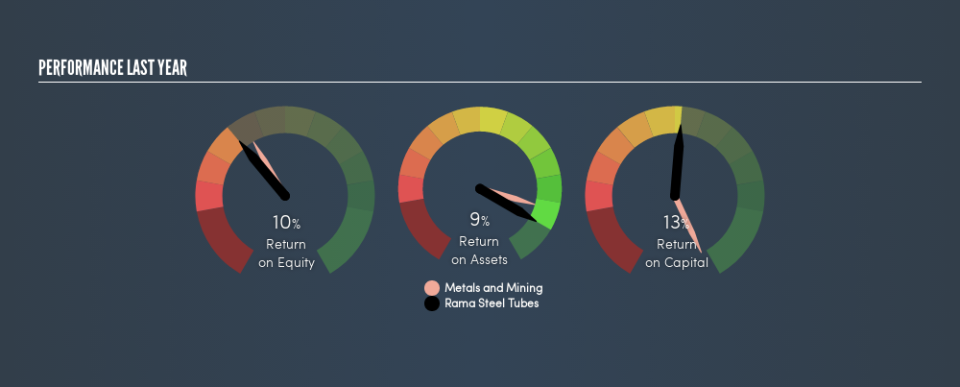
0.13 = ₹137m ÷ (₹2.0b - ₹926m) (Based on the trailing twelve months to March 2019.)
Therefore, Rama Steel Tubes has an ROCE of 13%.
View our latest analysis for Rama Steel Tubes
Does Rama Steel Tubes Have A Good ROCE?
One way to assess ROCE is to compare similar companies. It appears that Rama Steel Tubes's ROCE is fairly close to the Metals and Mining industry average of 14%. Separate from how Rama Steel Tubes stacks up against its industry, its ROCE in absolute terms is mediocre; relative to the returns on government bonds. It is possible that there are more rewarding investments out there.
Rama Steel Tubes's current ROCE of 13% is lower than 3 years ago, when the company reported a 31% ROCE. So investors might consider if it has had issues recently. You can click on the image below to see (in greater detail) how Rama Steel Tubes's past growth compares to other companies.
When considering ROCE, bear in mind that it reflects the past and does not necessarily predict the future. ROCE can be misleading for companies in cyclical industries, with returns looking impressive during the boom times, but very weak during the busts. ROCE is, after all, simply a snap shot of a single year. Given the industry it operates in, Rama Steel Tubes could be considered cyclical. If Rama Steel Tubes is cyclical, it could make sense to check out this free graph of past earnings, revenue and cash flow.
Rama Steel Tubes's Current Liabilities And Their Impact On Its ROCE
Current liabilities include invoices, such as supplier payments, short-term debt, or a tax bill, that need to be paid within 12 months. Due to the way ROCE is calculated, a high level of current liabilities makes a company look as though it has less capital employed, and thus can (sometimes unfairly) boost the ROCE. To check the impact of this, we calculate if a company has high current liabilities relative to its total assets.
Rama Steel Tubes has total assets of ₹2.0b and current liabilities of ₹926m. As a result, its current liabilities are equal to approximately 46% of its total assets. Rama Steel Tubes's middling level of current liabilities have the effect of boosting its ROCE a bit.
What We Can Learn From Rama Steel Tubes's ROCE
Despite this, its ROCE is still mediocre, and you may find more appealing investments elsewhere. But note: make sure you look for a great company, not just the first idea you come across. So take a peek at this free list of interesting companies with strong recent earnings growth (and a P/E ratio below 20).
If you are like me, then you will not want to miss this free list of growing companies that insiders are buying.
We aim to bring you long-term focused research analysis driven by fundamental data. Note that our analysis may not factor in the latest price-sensitive company announcements or qualitative material.
If you spot an error that warrants correction, please contact the editor at editorial-team@simplywallst.com. This article by Simply Wall St is general in nature. It does not constitute a recommendation to buy or sell any stock, and does not take account of your objectives, or your financial situation. Simply Wall St has no position in the stocks mentioned. Thank you for reading.
