Evaluating Sembcorp Industries Ltd’s (SGX:U96) Investments In Its Business

Today we'll evaluate Sembcorp Industries Ltd (SGX:U96) to determine whether it could have potential as an investment idea. Specifically, we'll consider its Return On Capital Employed (ROCE), since that will give us an insight into how efficiently the business can generate profits from the capital it requires.
Firstly, we'll go over how we calculate ROCE. Next, we'll compare it to others in its industry. Last but not least, we'll look at what impact its current liabilities have on its ROCE.
What is Return On Capital Employed (ROCE)?
ROCE is a measure of a company's yearly pre-tax profit (its return), relative to the capital employed in the business. Generally speaking a higher ROCE is better. In brief, it is a useful tool, but it is not without drawbacks. Renowned investment researcher Michael Mauboussin has suggested that a high ROCE can indicate that 'one dollar invested in the company generates value of more than one dollar'.
So, How Do We Calculate ROCE?
The formula for calculating the return on capital employed is:
Return on Capital Employed = Earnings Before Interest and Tax (EBIT) ÷ (Total Assets - Current Liabilities)
Or for Sembcorp Industries:
0.034 = S$625m ÷ (S$24b - S$5.5b) (Based on the trailing twelve months to March 2019.)
Therefore, Sembcorp Industries has an ROCE of 3.4%.
Want to participate in a short research study? Help shape the future of investing tools and you could win a $250 gift card!
See our latest analysis for Sembcorp Industries
Does Sembcorp Industries Have A Good ROCE?
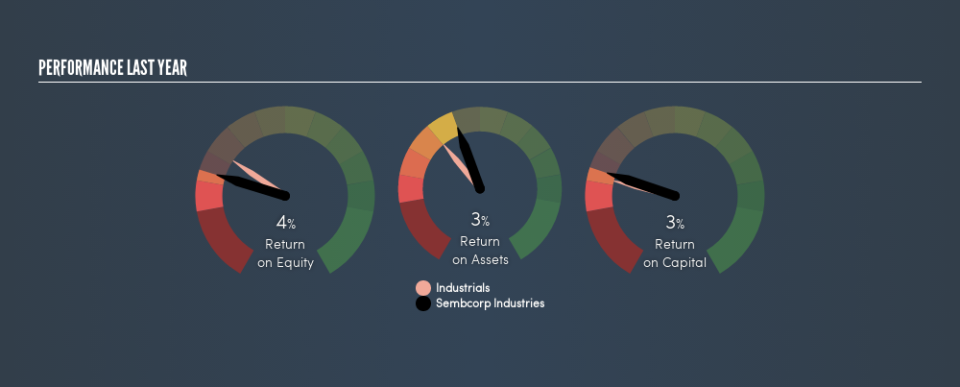
ROCE can be useful when making comparisons, such as between similar companies. It appears that Sembcorp Industries's ROCE is fairly close to the Industrials industry average of 3.4%. Regardless of how Sembcorp Industries stacks up against its industry, its ROCE in absolute terms is quite low (especially compared to a bank account). It is likely that there are more attractive prospects out there.
Remember that this metric is backwards looking - it shows what has happened in the past, and does not accurately predict the future. Companies in cyclical industries can be difficult to understand using ROCE, as returns typically look high during boom times, and low during busts. This is because ROCE only looks at one year, instead of considering returns across a whole cycle. Since the future is so important for investors, you should check out our free report on analyst forecasts for Sembcorp Industries.
How Sembcorp Industries's Current Liabilities Impact Its ROCE
Current liabilities are short term bills and invoices that need to be paid in 12 months or less. Due to the way ROCE is calculated, a high level of current liabilities makes a company look as though it has less capital employed, and thus can (sometimes unfairly) boost the ROCE. To counter this, investors can check if a company has high current liabilities relative to total assets.
Sembcorp Industries has total assets of S$24b and current liabilities of S$5.5b. As a result, its current liabilities are equal to approximately 23% of its total assets. This is a modest level of current liabilities, which will have a limited impact on the ROCE.
What We Can Learn From Sembcorp Industries's ROCE
While that is good to see, Sembcorp Industries has a low ROCE and does not look attractive in this analysis. Of course, you might also be able to find a better stock than Sembcorp Industries. So you may wish to see this free collection of other companies that have grown earnings strongly.
If you like to buy stocks alongside management, then you might just love this free list of companies. (Hint: insiders have been buying them).
We aim to bring you long-term focused research analysis driven by fundamental data. Note that our analysis may not factor in the latest price-sensitive company announcements or qualitative material.
If you spot an error that warrants correction, please contact the editor at editorial-team@simplywallst.com. This article by Simply Wall St is general in nature. It does not constitute a recommendation to buy or sell any stock, and does not take account of your objectives, or your financial situation. Simply Wall St has no position in the stocks mentioned. Thank you for reading.
