Evaluating New World Department Store China Limited’s (HKG:825) Investments In Its Business

Today we are going to look at New World Department Store China Limited (HKG:825) to see whether it might be an attractive investment prospect. Specifically, we're going to calculate its Return On Capital Employed (ROCE), in the hopes of getting some insight into the business.
Firstly, we'll go over how we calculate ROCE. Then we'll compare its ROCE to similar companies. And finally, we'll look at how its current liabilities are impacting its ROCE.
Understanding Return On Capital Employed (ROCE)
ROCE measures the 'return' (pre-tax profit) a company generates from capital employed in its business. Generally speaking a higher ROCE is better. Overall, it is a valuable metric that has its flaws. Author Edwin Whiting says to be careful when comparing the ROCE of different businesses, since 'No two businesses are exactly alike.
So, How Do We Calculate ROCE?
Analysts use this formula to calculate return on capital employed:
Return on Capital Employed = Earnings Before Interest and Tax (EBIT) ÷ (Total Assets - Current Liabilities)
Or for New World Department Store China:
0.055 = HK$396m ÷ (HK$12b - HK$4.6b) (Based on the trailing twelve months to June 2019.)
So, New World Department Store China has an ROCE of 5.5%.
Check out our latest analysis for New World Department Store China
Is New World Department Store China's ROCE Good?
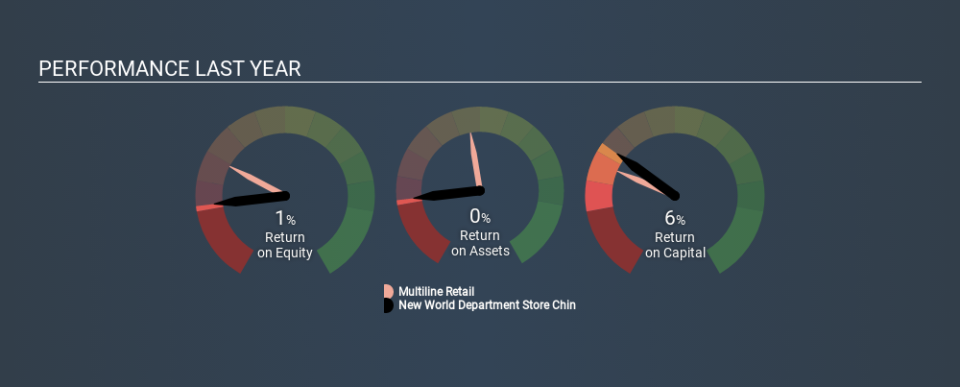
One way to assess ROCE is to compare similar companies. It appears that New World Department Store China's ROCE is fairly close to the Multiline Retail industry average of 6.5%. Separate from how New World Department Store China stacks up against its industry, its ROCE in absolute terms is mediocre; relative to the returns on government bonds. It is possible that there are more rewarding investments out there.
We can see that, New World Department Store China currently has an ROCE of 5.5% compared to its ROCE 3 years ago, which was 4.0%. This makes us wonder if the company is improving. You can click on the image below to see (in greater detail) how New World Department Store China's past growth compares to other companies.
When considering this metric, keep in mind that it is backwards looking, and not necessarily predictive. ROCE can be deceptive for cyclical businesses, as returns can look incredible in boom times, and terribly low in downturns. This is because ROCE only looks at one year, instead of considering returns across a whole cycle. If New World Department Store China is cyclical, it could make sense to check out this free graph of past earnings, revenue and cash flow.
Do New World Department Store China's Current Liabilities Skew Its ROCE?
Current liabilities are short term bills and invoices that need to be paid in 12 months or less. The ROCE equation subtracts current liabilities from capital employed, so a company with a lot of current liabilities appears to have less capital employed, and a higher ROCE than otherwise. To counter this, investors can check if a company has high current liabilities relative to total assets.
New World Department Store China has total assets of HK$12b and current liabilities of HK$4.6b. Therefore its current liabilities are equivalent to approximately 39% of its total assets. New World Department Store China's middling level of current liabilities have the effect of boosting its ROCE a bit.
The Bottom Line On New World Department Store China's ROCE
Unfortunately, its ROCE is still uninspiring, and there are potentially more attractive prospects out there. But note: make sure you look for a great company, not just the first idea you come across. So take a peek at this free list of interesting companies with strong recent earnings growth (and a P/E ratio below 20).
If you like to buy stocks alongside management, then you might just love this free list of companies. (Hint: insiders have been buying them).
If you spot an error that warrants correction, please contact the editor at editorial-team@simplywallst.com. This article by Simply Wall St is general in nature. It does not constitute a recommendation to buy or sell any stock, and does not take account of your objectives, or your financial situation. Simply Wall St has no position in the stocks mentioned.
We aim to bring you long-term focused research analysis driven by fundamental data. Note that our analysis may not factor in the latest price-sensitive company announcements or qualitative material. Thank you for reading.

