Is Evercore Inc.'s (NYSE:EVR) P/E Ratio Really That Good?

The goal of this article is to teach you how to use price to earnings ratios (P/E ratios). We'll look at Evercore Inc.'s (NYSE:EVR) P/E ratio and reflect on what it tells us about the company's share price. Looking at earnings over the last twelve months, Evercore has a P/E ratio of 10.97. In other words, at today's prices, investors are paying $10.97 for every $1 in prior year profit.
View our latest analysis for Evercore
How Do You Calculate A P/E Ratio?
The formula for P/E is:
Price to Earnings Ratio = Share Price ÷ Earnings per Share (EPS)
Or for Evercore:
P/E of 10.97 = USD81.62 ÷ USD7.44 (Based on the year to December 2019.)
Is A High Price-to-Earnings Ratio Good?
The higher the P/E ratio, the higher the price tag of a business, relative to its trailing earnings. All else being equal, it's better to pay a low price -- but as Warren Buffett said, 'It's far better to buy a wonderful company at a fair price than a fair company at a wonderful price'.
Does Evercore Have A Relatively High Or Low P/E For Its Industry?
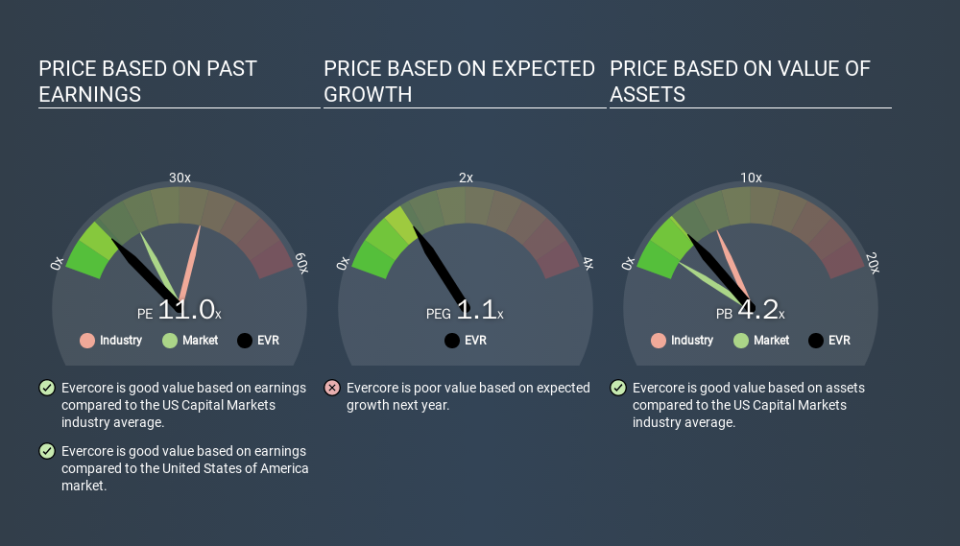
The P/E ratio indicates whether the market has higher or lower expectations of a company. The image below shows that Evercore has a lower P/E than the average (36.0) P/E for companies in the capital markets industry.
Evercore's P/E tells us that market participants think it will not fare as well as its peers in the same industry. Since the market seems unimpressed with Evercore, it's quite possible it could surprise on the upside. You should delve deeper. I like to check if company insiders have been buying or selling.
How Growth Rates Impact P/E Ratios
Probably the most important factor in determining what P/E a company trades on is the earnings growth. When earnings grow, the 'E' increases, over time. And in that case, the P/E ratio itself will drop rather quickly. And as that P/E ratio drops, the company will look cheap, unless its share price increases.
Evercore saw earnings per share decrease by 20% last year. But it has grown its earnings per share by 25% per year over the last five years.
Remember: P/E Ratios Don't Consider The Balance Sheet
Don't forget that the P/E ratio considers market capitalization. So it won't reflect the advantage of cash, or disadvantage of debt. Hypothetically, a company could reduce its future P/E ratio by spending its cash (or taking on debt) to achieve higher earnings.
While growth expenditure doesn't always pay off, the point is that it is a good option to have; but one that the P/E ratio ignores.
Is Debt Impacting Evercore's P/E?
Net debt totals just 2.1% of Evercore's market cap. The market might award it a higher P/E ratio if it had net cash, but its unlikely this low level of net borrowing is having a big impact on the P/E multiple.
The Verdict On Evercore's P/E Ratio
Evercore's P/E is 11.0 which is below average (18.3) in the US market. The debt levels are not a major concern, but the lack of EPS growth is likely weighing on sentiment.
Investors have an opportunity when market expectations about a stock are wrong. As value investor Benjamin Graham famously said, 'In the short run, the market is a voting machine but in the long run, it is a weighing machine. So this free report on the analyst consensus forecasts could help you make a master move on this stock.
Of course you might be able to find a better stock than Evercore. So you may wish to see this free collection of other companies that have grown earnings strongly.
If you spot an error that warrants correction, please contact the editor at editorial-team@simplywallst.com. This article by Simply Wall St is general in nature. It does not constitute a recommendation to buy or sell any stock, and does not take account of your objectives, or your financial situation. Simply Wall St has no position in the stocks mentioned.
We aim to bring you long-term focused research analysis driven by fundamental data. Note that our analysis may not factor in the latest price-sensitive company announcements or qualitative material. Thank you for reading.
