Evolution Mining Limited (ASX:EVN): Financial Strength Analysis

Want to participate in a short research study? Help shape the future of investing tools and you could win a $250 gift card!
Small and large cap stocks are widely popular for a variety of reasons, however, mid-cap companies such as Evolution Mining Limited (ASX:EVN), with a market cap of AU$7.4b, often get neglected by retail investors. However, generally ignored mid-caps have historically delivered better risk-adjusted returns than the two other categories of stocks. This article will examine EVN’s financial liquidity and debt levels to get an idea of whether the company can deal with cyclical downturns and maintain funds to accommodate strategic spending for future growth. Note that this commentary is very high-level and solely focused on financial health, so I suggest you dig deeper yourself into EVN here.
See our latest analysis for Evolution Mining
Does EVN Produce Much Cash Relative To Its Debt?
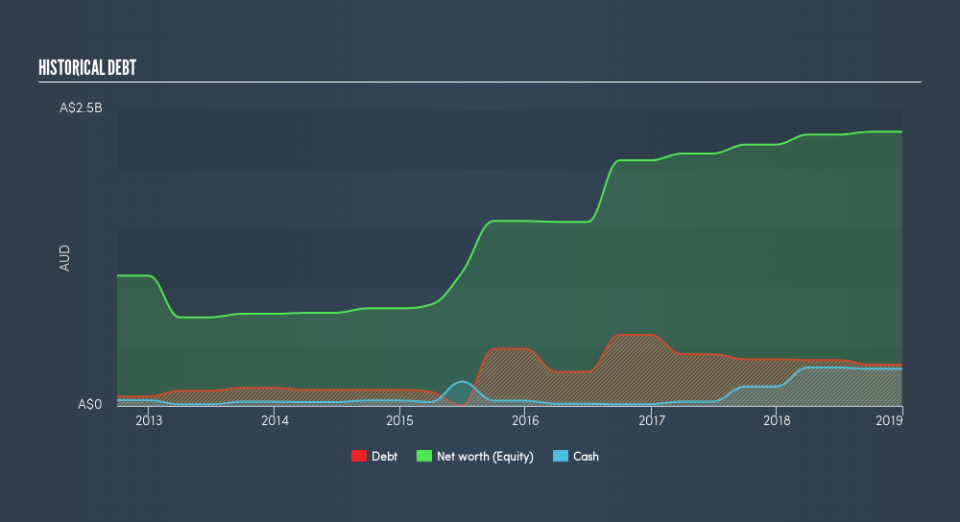
EVN's debt levels have fallen from AU$394m to AU$347m over the last 12 months , which also accounts for long term debt. With this debt payback, EVN currently has AU$314m remaining in cash and short-term investments , ready to be used for running the business. Moreover, EVN has generated AU$658m in operating cash flow during the same period of time, resulting in an operating cash to total debt ratio of 190%, indicating that EVN’s current level of operating cash is high enough to cover debt.
Can EVN meet its short-term obligations with the cash in hand?
With current liabilities at AU$276m, it seems that the business has been able to meet these obligations given the level of current assets of AU$638m, with a current ratio of 2.31x. The current ratio is calculated by dividing current assets by current liabilities. For Metals and Mining companies, this ratio is within a sensible range since there's a sufficient cash cushion without leaving too much capital idle or in low-earning investments.
Does EVN face the risk of succumbing to its debt-load?
With a debt-to-equity ratio of 15%, EVN's debt level may be seen as prudent. EVN is not taking on too much debt commitment, which can be restrictive and risky for equity-holders. We can check to see whether EVN is able to meet its debt obligations by looking at the net interest coverage ratio. A company generating earnings before interest and tax (EBIT) at least three times its net interest payments is considered financially sound. In EVN's, case, the ratio of 20.35x suggests that interest is comfortably covered, which means that debtors may be willing to loan the company more money, giving EVN ample headroom to grow its debt facilities.
Next Steps:
EVN’s high cash coverage and low debt levels indicate its ability to utilise its borrowings efficiently in order to generate ample cash flow. In addition to this, the company will be able to pay all of its upcoming liabilities from its current short-term assets. I admit this is a fairly basic analysis for EVN's financial health. Other important fundamentals need to be considered alongside. I suggest you continue to research Evolution Mining to get a better picture of the stock by looking at:
Future Outlook: What are well-informed industry analysts predicting for EVN’s future growth? Take a look at our free research report of analyst consensus for EVN’s outlook.
Valuation: What is EVN worth today? Is the stock undervalued, even when its growth outlook is factored into its intrinsic value? The intrinsic value infographic in our free research report helps visualize whether EVN is currently mispriced by the market.
Other High-Performing Stocks: Are there other stocks that provide better prospects with proven track records? Explore our free list of these great stocks here.
We aim to bring you long-term focused research analysis driven by fundamental data. Note that our analysis may not factor in the latest price-sensitive company announcements or qualitative material.
If you spot an error that warrants correction, please contact the editor at editorial-team@simplywallst.com. This article by Simply Wall St is general in nature. It does not constitute a recommendation to buy or sell any stock, and does not take account of your objectives, or your financial situation. Simply Wall St has no position in the stocks mentioned. Thank you for reading.

