Examining Kesla Oyj’s (HEL:KELAS) Weak Return On Capital Employed

Today we'll evaluate Kesla Oyj (HEL:KELAS) to determine whether it could have potential as an investment idea. To be precise, we'll consider its Return On Capital Employed (ROCE), as that will inform our view of the quality of the business.
First, we'll go over how we calculate ROCE. Then we'll compare its ROCE to similar companies. Then we'll determine how its current liabilities are affecting its ROCE.
Return On Capital Employed (ROCE): What is it?
ROCE is a metric for evaluating how much pre-tax income (in percentage terms) a company earns on the capital invested in its business. All else being equal, a better business will have a higher ROCE. Overall, it is a valuable metric that has its flaws. Author Edwin Whiting says to be careful when comparing the ROCE of different businesses, since 'No two businesses are exactly alike.
How Do You Calculate Return On Capital Employed?
Analysts use this formula to calculate return on capital employed:
Return on Capital Employed = Earnings Before Interest and Tax (EBIT) ÷ (Total Assets - Current Liabilities)
Or for Kesla Oyj:
0.069 = €1.6m ÷ (€33m - €9.6m) (Based on the trailing twelve months to December 2019.)
Therefore, Kesla Oyj has an ROCE of 6.9%.
View our latest analysis for Kesla Oyj
Does Kesla Oyj Have A Good ROCE?
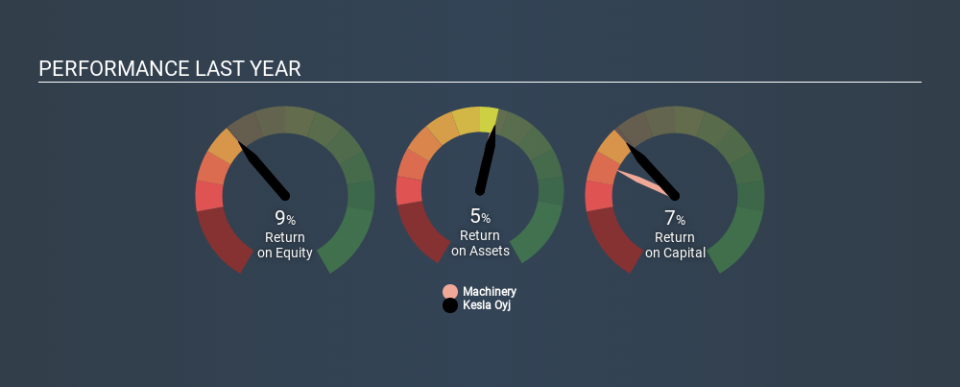
One way to assess ROCE is to compare similar companies. We can see Kesla Oyj's ROCE is meaningfully below the Machinery industry average of 9.2%. This performance could be negative if sustained, as it suggests the business may underperform its industry. Aside from the industry comparison, Kesla Oyj's ROCE is mediocre in absolute terms, considering the risk of investing in stocks versus the safety of a bank account. Investors may wish to consider higher-performing investments.
Our data shows that Kesla Oyj currently has an ROCE of 6.9%, compared to its ROCE of 4.1% 3 years ago. This makes us think about whether the company has been reinvesting shrewdly. The image below shows how Kesla Oyj's ROCE compares to its industry, and you can click it to see more detail on its past growth.
It is important to remember that ROCE shows past performance, and is not necessarily predictive. ROCE can be misleading for companies in cyclical industries, with returns looking impressive during the boom times, but very weak during the busts. This is because ROCE only looks at one year, instead of considering returns across a whole cycle. Future performance is what matters, and you can see analyst predictions in our free report on analyst forecasts for the company.
How Kesla Oyj's Current Liabilities Impact Its ROCE
Short term (or current) liabilities, are things like supplier invoices, overdrafts, or tax bills that need to be paid within 12 months. Due to the way ROCE is calculated, a high level of current liabilities makes a company look as though it has less capital employed, and thus can (sometimes unfairly) boost the ROCE. To counter this, investors can check if a company has high current liabilities relative to total assets.
Kesla Oyj has total assets of €33m and current liabilities of €9.6m. Therefore its current liabilities are equivalent to approximately 29% of its total assets. This is a modest level of current liabilities, which would only have a small effect on ROCE.
What We Can Learn From Kesla Oyj's ROCE
That said, Kesla Oyj's ROCE is mediocre, there may be more attractive investments around. Of course, you might also be able to find a better stock than Kesla Oyj. So you may wish to see this free collection of other companies that have grown earnings strongly.
For those who like to find winning investments this free list of growing companies with recent insider purchasing, could be just the ticket.
Love or hate this article? Concerned about the content? Get in touch with us directly. Alternatively, email editorial-team@simplywallst.com.
This article by Simply Wall St is general in nature. It does not constitute a recommendation to buy or sell any stock, and does not take account of your objectives, or your financial situation. We aim to bring you long-term focused analysis driven by fundamental data. Note that our analysis may not factor in the latest price-sensitive company announcements or qualitative material. Simply Wall St has no position in any stocks mentioned. Thank you for reading.
