Examining RaySearch Laboratories AB (publ)’s (STO:RAY B) Weak Return On Capital Employed

Today we are going to look at RaySearch Laboratories AB (publ) (STO:RAY B) to see whether it might be an attractive investment prospect. Specifically, we'll consider its Return On Capital Employed (ROCE), since that will give us an insight into how efficiently the business can generate profits from the capital it requires.
First of all, we'll work out how to calculate ROCE. Second, we'll look at its ROCE compared to similar companies. And finally, we'll look at how its current liabilities are impacting its ROCE.
Understanding Return On Capital Employed (ROCE)
ROCE measures the amount of pre-tax profits a company can generate from the capital employed in its business. In general, businesses with a higher ROCE are usually better quality. Overall, it is a valuable metric that has its flaws. Author Edwin Whiting says to be careful when comparing the ROCE of different businesses, since 'No two businesses are exactly alike.'
How Do You Calculate Return On Capital Employed?
Analysts use this formula to calculate return on capital employed:
Return on Capital Employed = Earnings Before Interest and Tax (EBIT) ÷ (Total Assets - Current Liabilities)
Or for RaySearch Laboratories:
0.088 = kr81m ÷ (kr1.2b - kr315m) (Based on the trailing twelve months to June 2019.)
So, RaySearch Laboratories has an ROCE of 8.8%.
See our latest analysis for RaySearch Laboratories
Is RaySearch Laboratories's ROCE Good?
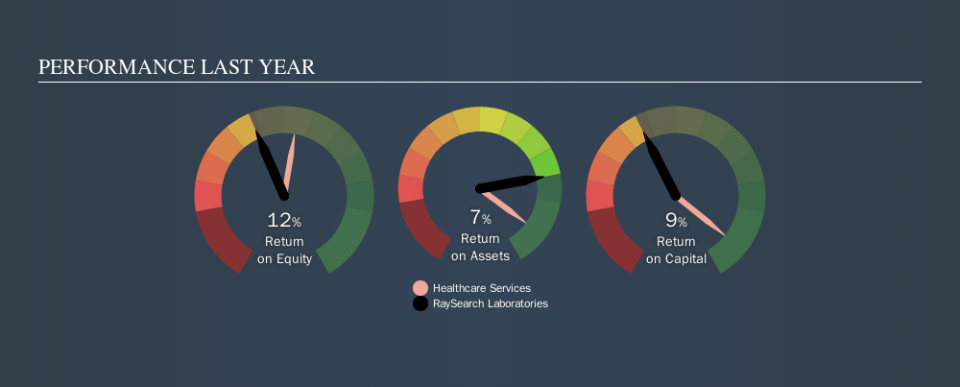
When making comparisons between similar businesses, investors may find ROCE useful. In this analysis, RaySearch Laboratories's ROCE appears meaningfully below the 16% average reported by the Healthcare Services industry. This performance is not ideal, as it suggests the company may not be deploying its capital as effectively as some competitors. Separate from RaySearch Laboratories's performance relative to its industry, its ROCE in absolute terms looks satisfactory, and it may be worth researching in more depth.
We can see that , RaySearch Laboratories currently has an ROCE of 8.8%, less than the 27% it reported 3 years ago. This makes us wonder if the business is facing new challenges. The image below shows how RaySearch Laboratories's ROCE compares to its industry, and you can click it to see more detail on its past growth.
Remember that this metric is backwards looking - it shows what has happened in the past, and does not accurately predict the future. ROCE can be misleading for companies in cyclical industries, with returns looking impressive during the boom times, but very weak during the busts. ROCE is only a point-in-time measure. What happens in the future is pretty important for investors, so we have prepared a free report on analyst forecasts for RaySearch Laboratories.
What Are Current Liabilities, And How Do They Affect RaySearch Laboratories's ROCE?
Short term (or current) liabilities, are things like supplier invoices, overdrafts, or tax bills that need to be paid within 12 months. Due to the way ROCE is calculated, a high level of current liabilities makes a company look as though it has less capital employed, and thus can (sometimes unfairly) boost the ROCE. To check the impact of this, we calculate if a company has high current liabilities relative to its total assets.
RaySearch Laboratories has total liabilities of kr315m and total assets of kr1.2b. Therefore its current liabilities are equivalent to approximately 25% of its total assets. A fairly low level of current liabilities is not influencing the ROCE too much.
Our Take On RaySearch Laboratories's ROCE
With that in mind, RaySearch Laboratories's ROCE appears pretty good. RaySearch Laboratories looks strong on this analysis, but there are plenty of other companies that could be a good opportunity . Here is a free list of companies growing earnings rapidly.
If you are like me, then you will not want to miss this free list of growing companies that insiders are buying.
We aim to bring you long-term focused research analysis driven by fundamental data. Note that our analysis may not factor in the latest price-sensitive company announcements or qualitative material.
If you spot an error that warrants correction, please contact the editor at editorial-team@simplywallst.com. This article by Simply Wall St is general in nature. It does not constitute a recommendation to buy or sell any stock, and does not take account of your objectives, or your financial situation. Simply Wall St has no position in the stocks mentioned. Thank you for reading.
