Extreme Gold/Silver Ratio Sends Mixed Signals for Precious Metals
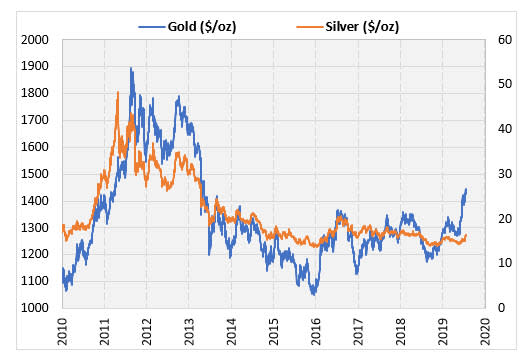
This week, I'm looking at gold and silver, which are behaving very strange lately relative to each other. The chart below shows the two commodities since 2010. Gold has shot higher recently to its highest levels since 2013. Silver, on the other hand, has moved higher recently, but has significantly lagged behind gold.
Gold/Silver Ratio Hits Quarter-Century High
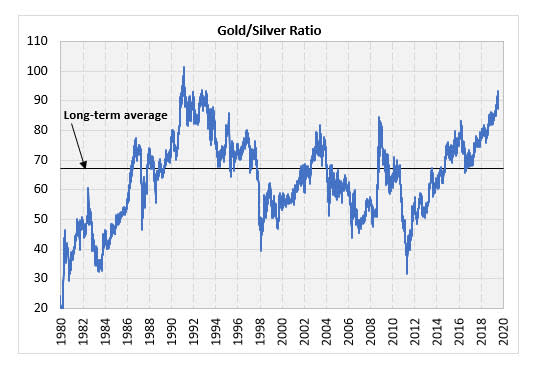
This has led to the highest gold/silver ratio in 25 years. The chart below shows how this ratio has surged over the past few years. The ratio has recently hit 90, while its average level since 1990 is right around 67. This week, I'm looking at how these assets perform based on these ratios.
Returns After Extreme Gold/Silver Ratios
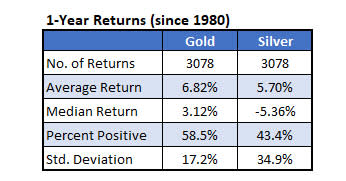
This table shows the typical one-year returns for gold and silver going back to 1980. Gold, since then, looks to have been the better investment. It has shown a much higher average return with a higher percentage of returns positive. Also, it has been much less volatile than silver. Next, we'll see what the returns look like when the ratio reaches high and low levels.
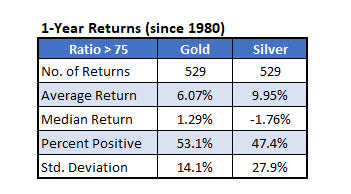
The theory would be that when the gold/silver ratio gets high, you would expect silver to outperform, which would return the ratio back toward more typical levels. The table below shows that the performance of gold when the ratio is high isn't much worse than its typical performance. The average return is still above 6% per year, and more than half of the returns have been positive.
As expected, silver does outperform after an extremely high gold/silver ratio reading. It averages a gain of close to 10% over the next year when the gold/silver ratio is high. Over half the returns, however, are still negative. While we have seen potential for outsized positive gains in silver when the ratio is high, the expectation has been that it decreases in value.
Clearer Signals from Low Gold/Silver Ratios
Finally, let's look at what has happened when this ratio gets low. In this case, you would expect gold to outperform silver, which would increase the ratio to normal levels. This is exactly what has happened in the past. When the ratio gets below 55, gold averages a gain of almost 12%, with 67.5% of the returns positive, over the next year.
Not only that, silver performs miserably. Silver averages a loss of about 2.5%, with just 43.5% of the returns positive.
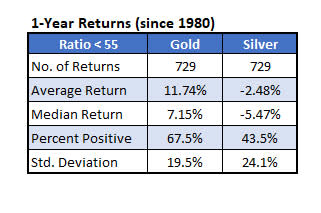
Unfortunately, at the current elevated gold/silver ratio, the outlook is more ambiguous compared to when the ratio is extremely low. Silver has tended to outperform when the ratio gets lofty, but still over half of the returns going forward were negative.
