How Do F-Secure Oyj’s (HEL:FSC1V) Returns On Capital Compare To Peers?

Today we'll evaluate F-Secure Oyj (HEL:FSC1V) to determine whether it could have potential as an investment idea. Specifically, we're going to calculate its Return On Capital Employed (ROCE), in the hopes of getting some insight into the business.
Firstly, we'll go over how we calculate ROCE. Then we'll compare its ROCE to similar companies. Last but not least, we'll look at what impact its current liabilities have on its ROCE.
Return On Capital Employed (ROCE): What is it?
ROCE is a metric for evaluating how much pre-tax income (in percentage terms) a company earns on the capital invested in its business. Generally speaking a higher ROCE is better. In brief, it is a useful tool, but it is not without drawbacks. Author Edwin Whiting says to be careful when comparing the ROCE of different businesses, since 'No two businesses are exactly alike.
So, How Do We Calculate ROCE?
The formula for calculating the return on capital employed is:
Return on Capital Employed = Earnings Before Interest and Tax (EBIT) ÷ (Total Assets - Current Liabilities)
Or for F-Secure Oyj:
0.043 = €5.6m ÷ (€229m - €99m) (Based on the trailing twelve months to December 2019.)
So, F-Secure Oyj has an ROCE of 4.3%.
Check out our latest analysis for F-Secure Oyj
Does F-Secure Oyj Have A Good ROCE?
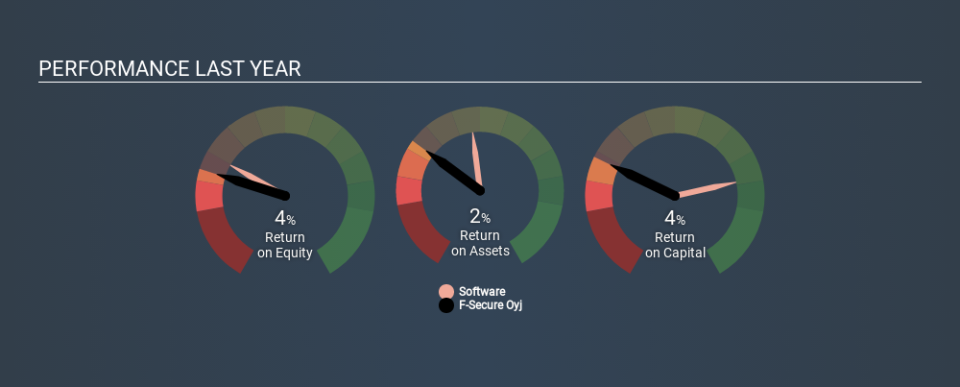
One way to assess ROCE is to compare similar companies. Using our data, F-Secure Oyj's ROCE appears to be significantly below the 11% average in the Software industry. This performance could be negative if sustained, as it suggests the business may underperform its industry. Setting aside the industry comparison for now, F-Secure Oyj's ROCE is mediocre in absolute terms, considering the risk of investing in stocks versus the safety of a bank account. Investors may wish to consider higher-performing investments.
F-Secure Oyj's current ROCE of 4.3% is lower than its ROCE in the past, which was 21%, 3 years ago. So investors might consider if it has had issues recently. The image below shows how F-Secure Oyj's ROCE compares to its industry, and you can click it to see more detail on its past growth.
It is important to remember that ROCE shows past performance, and is not necessarily predictive. ROCE can be deceptive for cyclical businesses, as returns can look incredible in boom times, and terribly low in downturns. This is because ROCE only looks at one year, instead of considering returns across a whole cycle. Since the future is so important for investors, you should check out our free report on analyst forecasts for F-Secure Oyj.
F-Secure Oyj's Current Liabilities And Their Impact On Its ROCE
Liabilities, such as supplier bills and bank overdrafts, are referred to as current liabilities if they need to be paid within 12 months. The ROCE equation subtracts current liabilities from capital employed, so a company with a lot of current liabilities appears to have less capital employed, and a higher ROCE than otherwise. To check the impact of this, we calculate if a company has high current liabilities relative to its total assets.
F-Secure Oyj has total assets of €229m and current liabilities of €99m. Therefore its current liabilities are equivalent to approximately 43% of its total assets. F-Secure Oyj's middling level of current liabilities have the effect of boosting its ROCE a bit.
What We Can Learn From F-Secure Oyj's ROCE
Unfortunately, its ROCE is still uninspiring, and there are potentially more attractive prospects out there. You might be able to find a better investment than F-Secure Oyj. If you want a selection of possible winners, check out this free list of interesting companies that trade on a P/E below 20 (but have proven they can grow earnings).
I will like F-Secure Oyj better if I see some big insider buys. While we wait, check out this free list of growing companies with considerable, recent, insider buying.
If you spot an error that warrants correction, please contact the editor at editorial-team@simplywallst.com. This article by Simply Wall St is general in nature. It does not constitute a recommendation to buy or sell any stock, and does not take account of your objectives, or your financial situation. Simply Wall St has no position in the stocks mentioned.
We aim to bring you long-term focused research analysis driven by fundamental data. Note that our analysis may not factor in the latest price-sensitive company announcements or qualitative material. Thank you for reading.
