Is Facebook, Inc.’s (NASDAQ:FB) 24% Better Than Average?

One of the best investments we can make is in our own knowledge and skill set. With that in mind, this article will work through how we can use Return On Equity (ROE) to better understand a business. We’ll use ROE to examine Facebook, Inc. (NASDAQ:FB), by way of a worked example.
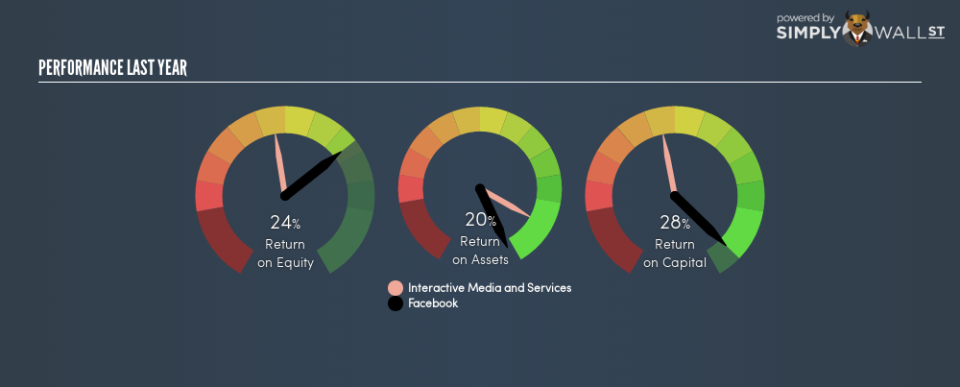
Over the last twelve months Facebook has recorded a ROE of 24%. One way to conceptualize this, is that for each $1 of shareholders’ equity it has, the company made $0.24 in profit.
View our latest analysis for Facebook
Want to help shape the future of investing tools and platforms? Take the survey and be part of one of the most advanced studies of stock market investors to date.
How Do You Calculate Return On Equity?
The formula for ROE is:
Return on Equity = Net Profit ÷ Shareholders’ Equity
Or for Facebook:
24% = 19497 ÷ US$80b (Based on the trailing twelve months to September 2018.)
Most know that net profit is the total earnings after all expenses, but the concept of shareholders’ equity is a little more complicated. It is all earnings retained by the company, plus any capital paid in by shareholders. You can calculate shareholders’ equity by subtracting the company’s total liabilities from its total assets.
What Does ROE Signify?
Return on Equity measures a company’s profitability against the profit it has kept for the business (plus any capital injections). The ‘return’ is the amount earned after tax over the last twelve months. That means that the higher the ROE, the more profitable the company is. So, all else equal, investors should like a high ROE. That means ROE can be used to compare two businesses.
Does Facebook Have A Good ROE?
By comparing a company’s ROE with its industry average, we can get a quick measure of how good it is. Importantly, this is far from a perfect measure, because companies differ significantly within the same industry classification. As you can see in the graphic below, Facebook has a higher ROE than the average (15%) in the Interactive Media and Services industry.
That’s what I like to see. I usually take a closer look when a company has a better ROE than industry peers. For example you might check if insiders are buying shares.
The Importance Of Debt To Return On Equity
Virtually all companies need money to invest in the business, to grow profits. That cash can come from issuing shares, retained earnings, or debt. In the first two cases, the ROE will capture this use of capital to grow. In the latter case, the debt used for growth will improve returns, but won’t affect the total equity. Thus the use of debt can improve ROE, albeit along with extra risk in the case of stormy weather, metaphorically speaking.
Combining Facebook’s Debt And Its 24% Return On Equity
Facebook has a debt to equity ratio of just 0.00087, which is very low. Its ROE is very impressive, and given only modest debt, this suggests the business is high quality. Judicious use of debt to improve returns can certainly be a good thing, although it does elevate risk slightly and reduce future optionality.
The Bottom Line On ROE
Return on equity is useful for comparing the quality of different businesses. A company that can achieve a high return on equity without debt could be considered a high quality business. If two companies have the same ROE, then I would generally prefer the one with less debt.
But ROE is just one piece of a bigger puzzle, since high quality businesses often trade on high multiples of earnings. It is important to consider other factors, such as future profit growth — and how much investment is required going forward. So you might want to check this FREE visualization of analyst forecasts for the company.
Of course, you might find a fantastic investment by looking elsewhere. So take a peek at this free list of interesting companies.
To help readers see past the short term volatility of the financial market, we aim to bring you a long-term focused research analysis purely driven by fundamental data. Note that our analysis does not factor in the latest price-sensitive company announcements.
The author is an independent contributor and at the time of publication had no position in the stocks mentioned. For errors that warrant correction please contact the editor at editorial-team@simplywallst.com.
