Fairfax County Coronavirus Update: Weekly Trend Of Cases, Deaths
FAIRFAX COUNTY, VA — As of Monday, Fairfax County has 15,455 cumulative coronavirus cases, 1,855 hospitalizations and 517 deaths. Because the county is Virginia's most populous jurisdiction, it's no surprise it leads the state in these coronavirus numbers. A closer looks at the data trends shows the situation has improved in Fairfax County over recent weeks.
We're taking a look at the week-by-week changes in cases, hospitalizations and deaths in Fairfax County. Data comes from the Virginia Department of Health's COVID-19 Daily Dashboard, which provides daily numbers of cases, deaths, and hospitalizations under the locality tab.
Cases
Looking at week-by-week changes in new cases, Fairfax County had a notable decline from early June to mid-June. New cases have remained stable in the weeks since the decline. The peak — over 2,000 new cases — happened between the weeks of May 24 and May 31.
New Coronavirus Cases In Fairfax County By Week
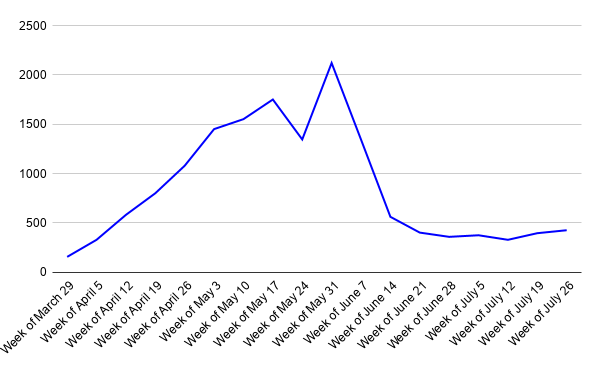
Below, we've listed case totals at the beginning of each week and the case increases since the previous week.
Week of July 26: 15,304, increase of 426 cases
Week of July 19: 14,878, increase of 396 cases
Week of July 12: 14,482, increase of 329 cases
Week of July 5: 14,153, increase of 375 cases
Week of June 28: 13,778, increase of 359 cases
Week of June 21: 13,419, increase of 402 cases
Week of June 14: 13,017, increase of 562 cases
Week of June 7: 12,455, increase of 1,345 cases
Week of May 31: 11,110, increase of 2,121 cases
Week of May 24: 8,989, increase of 1,346 cases
Week of May 17: 7,643, increase of 1,751 cases
Week of May 10: 5,892, increase of 1,552 cases
Week of May 3: 4,340, increase of 1,451 cases
Week of April 26: 2,889, increase of 1,080 cases
Week of April 19: 1,809, increase of 801 cases
Week of April 12: 1,008, increase of 582 cases
Week of April 5: 426, increase of 329 cases
Week of March 29: 187, increase of 156 cases
Deaths
Deaths have been in the single digits in recent weeks. The peak week-to-week change of deaths was 89 between the weeks of April 26 and May 3.
While there are cases in every age group in the Fairfax Health District, most deaths are in the 80 and up age group. There are 297 deaths in this age group, followed by 116 deaths in the 70 to 79 age group, 65 deaths in the 60 to 69 age group and 33 deaths in the 50 to 59 age group.
New Coronavirus Deaths by Week in Fairfax County
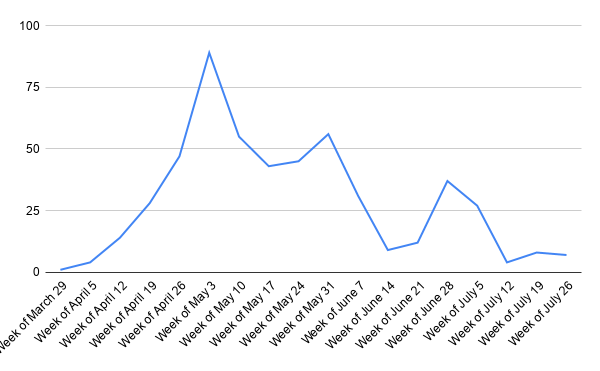
Here are the death totals at the beginning of each week and the increases since the previous week.
Week of July 26: 515, increase of seven
Week of July 19: 508, increase of eight
Week of July 12: 500, increase of four
Week of July 5: 496, increase of 27
Week of June 28: 472, increase of 37
Week of June 21: 435, increase of 12
Week of June 14: 423, increase of nine
Week of June 7: 414, increase of 31
Week of May 31: 383, increase of 56
Week of May 24: 327, increase of 45
Week of May 17: 282, increase of 43
Week of May 10: 239, increase of 55
Week of May 3: 184, increase of 89
Week of April 26: 95, increase of 47
Week of April 19: 48, increase of 28
Week of April 12: 20, increase of 14
Week of April 5: six, increase of four
Week of March 29: two, increase of one
Hospitalizations
Like deaths, hospitalizations haven't increased much in recent weeks. The numbers of new hospitalizations by week have remained below 100 since mid-June. As with deaths, the peak week-to-week change of hospitalizations happened between the weeks of April 26 and May 3 — 230 new hospitalizations.
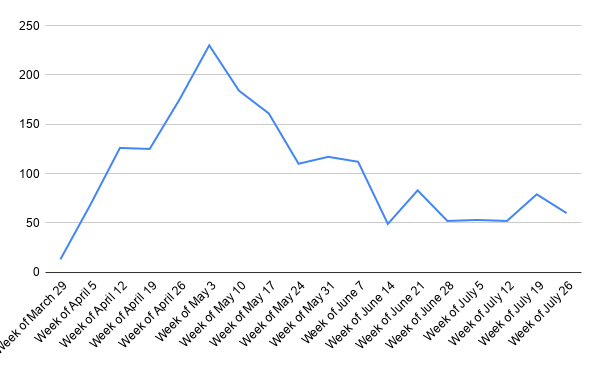
Below, we've listed hospitalization totals at the beginning of each week and the increases since the previous week.
Week of July 26: 1,851, increase of 60
Week of July 19: 1,791, increase of 79
Week of July 12: 1,712, increase of 52
Week of July 5: 1,660, increase of 53
Week of June 28: 1,607, increase of 52
Week of June 21: 1,555, increase of 83
Week of June 14: 1,472, increase of 49
Week of June 7: 1,423, increase of 112
Week of May 31: 1,311, increase of 117
Week of May 24: 1,194, increase of 110
Week of May 17: 1,084, increase of 161
Week of May 10: 923, increase of 184
Week of May 3: 739, increase of 230
Week of April 26: 509, increase of 175
Week of April 19: 334, increase of 125
Week of April 12: 209, increase of 126
Week of April 5: 83, increase of 68
Week of March 29: 15, increase of 13
For more coronavirus data, including cases by ZIP code, see the VDH and Fairfax County Health Department's dashboards.
This article originally appeared on the Kingstowne-Rose Hill Patch

