Far East Global Group Limited's (HKG:830) Earnings Grew 47%, Did It Beat Long-Term Trend?

Understanding Far East Global Group Limited's (HKG:830) performance as a company requires examining more than earnings from one point in time. Today I will take you through a basic sense check to gain perspective on how Far East Global Group is doing by evaluating its latest earnings with its longer term trend as well as its industry peers' performance over the same period.
Check out our latest analysis for Far East Global Group
How Did 830's Recent Performance Stack Up Against Its Past?
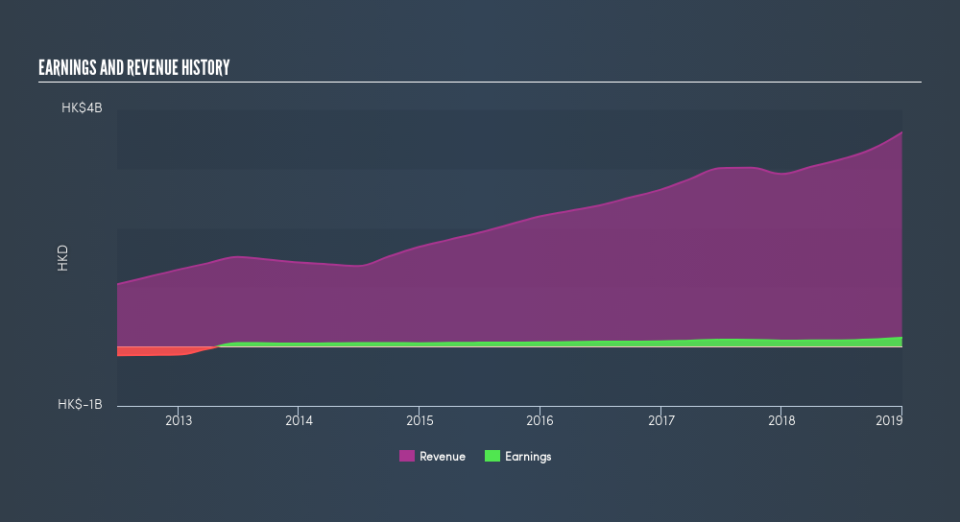
830's trailing twelve-month earnings (from 31 December 2018) of HK$149m has jumped 47% compared to the previous year.
Furthermore, this one-year growth rate has exceeded its 5-year annual growth average of 19%, indicating the rate at which 830 is growing has accelerated. How has it been able to do this? Let's take a look at whether it is merely a result of industry tailwinds, or if Far East Global Group has seen some company-specific growth.
In terms of returns from investment, Far East Global Group has fallen short of achieving a 20% return on equity (ROE), recording 14% instead. However, its return on assets (ROA) of 5.2% exceeds the HK Building industry of 4.6%, indicating Far East Global Group has used its assets more efficiently. And finally, its return on capital (ROC), which also accounts for Far East Global Group’s debt level, has increased over the past 3 years from 3.1% to 19%. This correlates with a decrease in debt holding, with debt-to-equity ratio declining from 72% to 69% over the past 5 years.
What does this mean?
While past data is useful, it doesn’t tell the whole story. While Far East Global Group has a good historical track record with positive growth and profitability, there's no certainty that this will extrapolate into the future. You should continue to research Far East Global Group to get a better picture of the stock by looking at:
Future Outlook: What are well-informed industry analysts predicting for 830’s future growth? Take a look at our free research report of analyst consensus for 830’s outlook.
Financial Health: Are 830’s operations financially sustainable? Balance sheets can be hard to analyze, which is why we’ve done it for you. Check out our financial health checks here.
Other High-Performing Stocks: Are there other stocks that provide better prospects with proven track records? Explore our free list of these great stocks here.
NB: Figures in this article are calculated using data from the trailing twelve months from 31 December 2018. This may not be consistent with full year annual report figures.
We aim to bring you long-term focused research analysis driven by fundamental data. Note that our analysis may not factor in the latest price-sensitive company announcements or qualitative material.
If you spot an error that warrants correction, please contact the editor at editorial-team@simplywallst.com. This article by Simply Wall St is general in nature. It does not constitute a recommendation to buy or sell any stock, and does not take account of your objectives, or your financial situation. Simply Wall St has no position in the stocks mentioned. Thank you for reading.

