Is Ferguson plc's (LON:FERG) P/E Ratio Really That Good?

Want to participate in a short research study? Help shape the future of investing tools and you could win a $250 gift card!
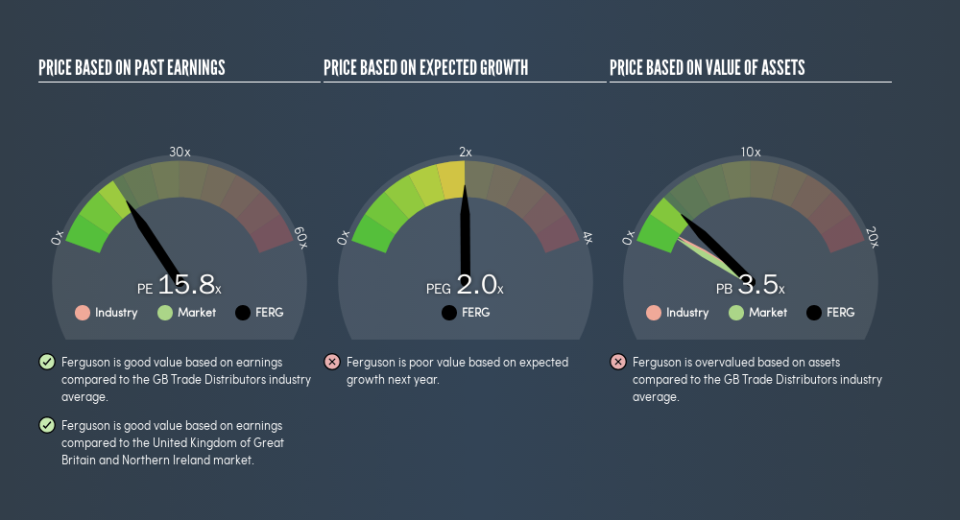
The goal of this article is to teach you how to use price to earnings ratios (P/E ratios). To keep it practical, we'll show how Ferguson plc's (LON:FERG) P/E ratio could help you assess the value on offer. What is Ferguson's P/E ratio? Well, based on the last twelve months it is 15.77. That means that at current prices, buyers pay £15.77 for every £1 in trailing yearly profits.
See our latest analysis for Ferguson
How Do You Calculate Ferguson's P/E Ratio?
The formula for price to earnings is:
Price to Earnings Ratio = Price per Share (in the reporting currency) ÷ Earnings per Share (EPS)
Or for Ferguson:
P/E of 15.77 = $64.66 (Note: this is the share price in the reporting currency, namely, USD ) ÷ $4.1 (Based on the trailing twelve months to January 2019.)
Is A High Price-to-Earnings Ratio Good?
A higher P/E ratio means that investors are paying a higher price for each £1 of company earnings. That is not a good or a bad thing per se, but a high P/E does imply buyers are optimistic about the future.
How Growth Rates Impact P/E Ratios
Earnings growth rates have a big influence on P/E ratios. Earnings growth means that in the future the 'E' will be higher. That means even if the current P/E is high, it will reduce over time if the share price stays flat. So while a stock may look expensive based on past earnings, it could be cheap based on future earnings.
Ferguson's earnings per share fell by 11% in the last twelve months. But EPS is up 10% over the last 5 years.
How Does Ferguson's P/E Ratio Compare To Its Peers?
We can get an indication of market expectations by looking at the P/E ratio. As you can see below Ferguson has a P/E ratio that is fairly close for the average for the trade distributors industry, which is 16.1.
That indicates that the market expects Ferguson will perform roughly in line with other companies in its industry. So if Ferguson actually outperforms its peers going forward, that should be a positive for the share price. Further research into factors such asmanagement tenure, could help you form your own view on whether that is likely.
A Limitation: P/E Ratios Ignore Debt and Cash In The Bank
The 'Price' in P/E reflects the market capitalization of the company. That means it doesn't take debt or cash into account. Theoretically, a business can improve its earnings (and produce a lower P/E in the future) by investing in growth. That means taking on debt (or spending its cash).
While growth expenditure doesn't always pay off, the point is that it is a good option to have; but one that the P/E ratio ignores.
Ferguson's Balance Sheet
Net debt totals 13% of Ferguson's market cap. This could bring some additional risk, and reduce the number of investment options for management; worth remembering if you compare its P/E to businesses without debt.
The Bottom Line On Ferguson's P/E Ratio
Ferguson has a P/E of 15.8. That's around the same as the average in the GB market, which is 16.1. When you consider the lack of EPS growth last year (along with some debt), it seems the market is optimistic about the future for the business.
When the market is wrong about a stock, it gives savvy investors an opportunity. If the reality for a company is not as bad as the P/E ratio indicates, then the share price should increase as the market realizes this. So this free report on the analyst consensus forecasts could help you make a master move on this stock.
You might be able to find a better buy than Ferguson. If you want a selection of possible winners, check out this free list of interesting companies that trade on a P/E below 20 (but have proven they can grow earnings).
We aim to bring you long-term focused research analysis driven by fundamental data. Note that our analysis may not factor in the latest price-sensitive company announcements or qualitative material.
If you spot an error that warrants correction, please contact the editor at editorial-team@simplywallst.com. This article by Simply Wall St is general in nature. It does not constitute a recommendation to buy or sell any stock, and does not take account of your objectives, or your financial situation. Simply Wall St has no position in the stocks mentioned. Thank you for reading.
