Are Filta Group Holdings plc's (LON:FLTA) Interest Costs Too High?

Want to participate in a short research study? Help shape the future of investing tools and you could win a $250 gift card!
Investors are always looking for growth in small-cap stocks like Filta Group Holdings plc (LON:FLTA), with a market cap of UK£55m. However, an important fact which most ignore is: how financially healthy is the business? Evaluating financial health as part of your investment thesis is vital, as mismanagement of capital can lead to bankruptcies, which occur at a higher rate for small-caps. We'll look at some basic checks that can form a snapshot the company’s financial strength. Nevertheless, potential investors would need to take a closer look, and I’d encourage you to dig deeper yourself into FLTA here.
FLTA’s Debt (And Cash Flows)
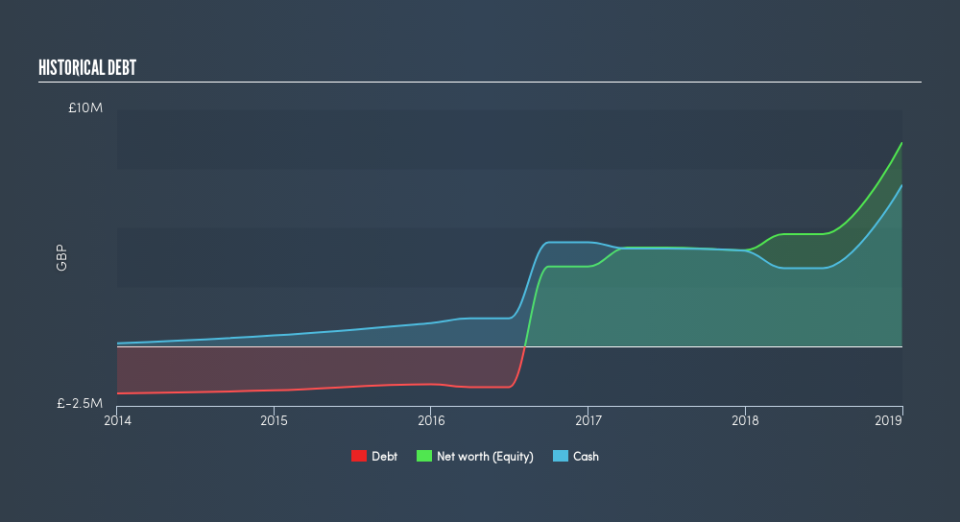
FLTA has built up its total debt levels in the last twelve months, from UK£1.0m to UK£4.7m , which includes long-term debt. With this rise in debt, FLTA currently has UK£6.8m remaining in cash and short-term investments to keep the business going. On top of this, FLTA has produced cash from operations of UK£805k over the same time period, leading to an operating cash to total debt ratio of 17%, indicating that FLTA’s current level of operating cash is not high enough to cover debt.
Does FLTA’s liquid assets cover its short-term commitments?
At the current liabilities level of UK£8.2m, it seems that the business has maintained a safe level of current assets to meet its obligations, with the current ratio last standing at 1.59x. The current ratio is the number you get when you divide current assets by current liabilities. Generally, for Commercial Services companies, this is a reasonable ratio since there is a bit of a cash buffer without leaving too much capital in a low-return environment.
Does FLTA face the risk of succumbing to its debt-load?
With debt reaching 55% of equity, FLTA may be thought of as relatively highly levered. This is a bit unusual for a small-cap stock, since they generally have a harder time borrowing than large more established companies. We can check to see whether FLTA is able to meet its debt obligations by looking at the net interest coverage ratio. A company generating earnings before interest and tax (EBIT) at least three times its net interest payments is considered financially sound. In FLTA's, case, the ratio of 47.76x suggests that interest is comfortably covered, which means that lenders may be inclined to lend more money to the company, as it is seen as safe in terms of payback.
Next Steps:
FLTA’s high cash coverage means that, although its debt levels are high, the company is able to utilise its borrowings efficiently in order to generate cash flow. This may mean this is an optimal capital structure for the business, given that it is also meeting its short-term commitment. Keep in mind I haven't considered other factors such as how FLTA has been performing in the past. I recommend you continue to research Filta Group Holdings to get a better picture of the small-cap by looking at:
Future Outlook: What are well-informed industry analysts predicting for FLTA’s future growth? Take a look at our free research report of analyst consensus for FLTA’s outlook.
Valuation: What is FLTA worth today? Is the stock undervalued, even when its growth outlook is factored into its intrinsic value? The intrinsic value infographic in our free research report helps visualize whether FLTA is currently mispriced by the market.
Other High-Performing Stocks: Are there other stocks that provide better prospects with proven track records? Explore our free list of these great stocks here.
We aim to bring you long-term focused research analysis driven by fundamental data. Note that our analysis may not factor in the latest price-sensitive company announcements or qualitative material.
If you spot an error that warrants correction, please contact the editor at editorial-team@simplywallst.com. This article by Simply Wall St is general in nature. It does not constitute a recommendation to buy or sell any stock, and does not take account of your objectives, or your financial situation. Simply Wall St has no position in the stocks mentioned. Thank you for reading.

