From LBJ to Biden: How the Economy Performed Under Each President
The economy is big, complex and difficult for most people to understand. In reality, the president may not have as much control over the economy as people tend to think — the Federal Reserve, for instance, has a much more direct influence over how well the economy does.
Check Out: How Much Is President Joe Biden Worth As He Seeks Re-Election?
Read More: Here’s How Much Every Living US President Is Worth: Where Does Biden Rank?
Nevertheless, economic performance continues to heavily influence how people choose to vote. If the economy does well, an incumbent president has a much better chance of being re-elected. If there is a recession, their chances may be slim.
To be fair, the president does have some power to influence the economy. For one, trade policy can make a big impact. And during times of crisis, the president can expedite relief that may significantly lessen the long-term economic damage that may otherwise have lingered.
Still, the economy is complex. When we dive into the numbers (which we’ll do shortly — the numbers will be what they were when their terms ended), we realize most presidents have been good for the economy in some ways, and less good in others. This highlights the fact that despite what presidents say, their real-world economic impact may not be quite what we expect.
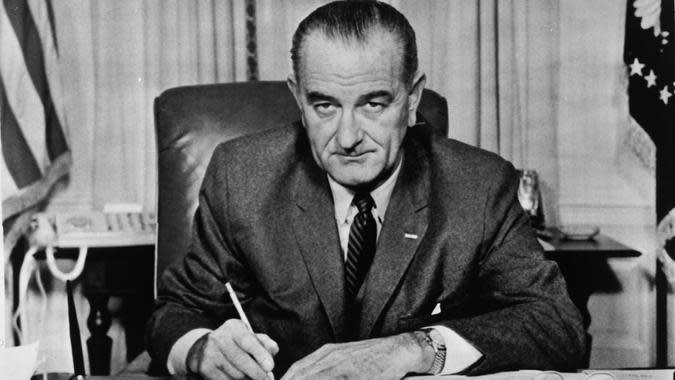
Lyndon B. Johnson (1963-1969)
GDP growth: 2.6%
Unemployment rate: 3.4%
Inflation rate: 4.4%
Poverty rate: 12.80%
Real disposable income per capita: $17,181
Disposable income per capita (adjusted for inflation): $130,520
Lyndon B. Johnson had many notable accomplishments, including the Clean Air Act and the Civil Rights Act. His presidency saw modest GDP growth but had the highest inflation-adjusted income on this list, along with the lowest unemployment rate. He is in the middle of the pack for inflation and poverty rates.
Find Out: How Rich Is Former President Donald Trump?
Explore More: How Rich Is Kevin McCarthy?
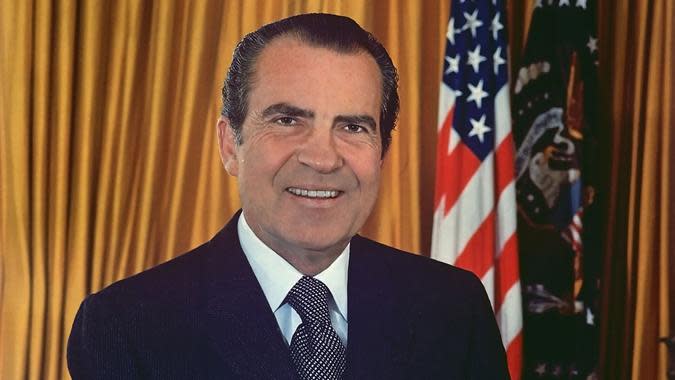
Richard Nixon (1969-1974)
GDP growth: 2.0%
Unemployment rate: 5.5%
Inflation rate: 10.9%
Poverty rate: 12.00%
Real disposable income per capita: $19,621
Disposable income per capita (adjusted for inflation): $110,961
Richard Nixon served one full term and resigned during his second term as a result of the Watergate scandal, becoming the first (and still only) president ever to do so. His presidency saw the second-highest rate of inflation mentioned here but also the second-highest inflation-adjusted income per capita. GDP growth was the fifth-lowest during his presidency, although he is in the middle of the pack for unemployment.
Trending Now: 25 Richest US Politicians
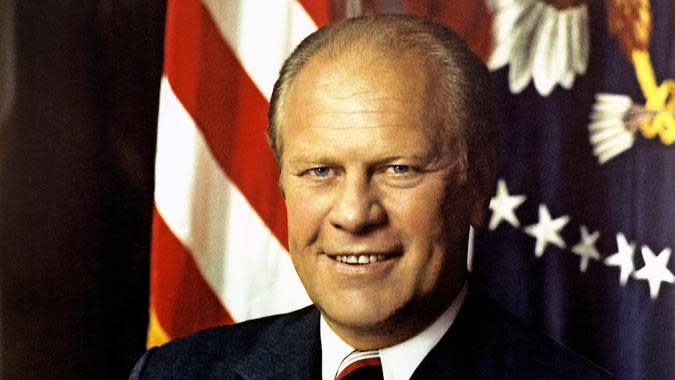
Gerald Ford (1974-1977)
GDP growth: 2.8%
Unemployment rate: 7.5%
Inflation rate: 5.2%
Poverty rate: 11.90%
Real disposable income per capita: $20,780
Disposable income per capita (adjusted for inflation): $95,602
Ford’s presidency, which lasted just 895 days, saw the second-highest rate of unemployment — second only to George W. Bush, who served during the Great Recession. On the plus side, he had the third-highest GDP growth, and poverty rates were on the low end. Inflation was third-highest during his presidency as well.

Jimmy Carter (1977-1981)
GDP growth: 4.6%
Unemployment rate: 7.4%
Inflation rate: 11.8%
Poverty rate: 13.00%
Real disposable income per capita: $21,891
Disposable income per capita (adjusted for inflation): $67,143
Jimmy Carter served for four years, from 1977 to 1981, and his presidency was unusual when you look at the numbers. His presidency had by far the highest GDP growth, more than 1% higher than President Joe Biden thus far. But he also had the highest inflation rate and the third-highest unemployment rate. He is in the middle of the pack for poverty rates.

Ronald Reagan (1981-1989)
GDP growth: 2.1%
Unemployment rate: 5.4%
Inflation rate: 4.7%
Poverty rate: 13.10%
Real disposable income per capita: $27,080
Disposable income per capita (adjusted for inflation): $60,887
Reagan’s presidency was marked mostly by numbers that don’t really stand out on either end. His unemployment rate is the fifth-lowest, but it is a full 2% higher than Johnson’s. He is fifth-highest for inflation, but at 4.7%, inflation during Reagan’s presidency was less than half of what it was during Carter’s. What may stand out the most is his 13.10% poverty rate, which is just slightly lower than George H.W. Bush, who has the highest poverty rate on this list.
Discover More: How Big Is Senator Lindsey Graham’s Social Security Check?
George H. W. Bush (1989-1993)
GDP growth: 0.7%
Unemployment rate: 7.3%
Inflation rate: 3.3%
Poverty rate: 14.50%
Real disposable income per capita: $27,990
Disposable income per capita (adjusted for inflation): $54,005
The aforementioned George H. W. Bush doesn’t have much going for him in terms of numbers; he has the highest poverty rate and the third-lowest GDP growth. His unemployment rate is also high at 7.3%, coming in just below Jimmy Carter. His biggest win is inflation, where he is fourth-lowest on this list.

Bill Clinton (1993-2001)
GDP growth: 0.3%
Unemployment rate: 4.2%
Inflation rate: 3.7%
Poverty rate: 11.30%
Real disposable income per capita: $34,216
Disposable income per capita (adjusted for inflation): $53,895
Clinton’s presidency was not too different from his predecessor’s in terms of the numbers, which may highlight the president’s limited control over the economy. For instance, Clinton also had very slight GDP growth along with a low rate of inflation. That being said, he is the polar opposite of H. W. on poverty — H. W. has the highest poverty rate, and Clinton has the lowest. Clinton also has the third-lowest unemployment rate, in contrast to his predecessor.
George W. Bush (2001-2009)
GDP growth: -1.2%
Unemployment rate: 7.8%
Inflation rate: 0.0%
Poverty rate: 13.20%
Real disposable income per capita: $37,814
Disposable income per capita (adjusted for inflation): $49,141
Serving during the Great Recession means Bush’s numbers were bound to look bad. Indeed, he is the only president with a negative rate of GDP growth, and he has the highest unemployment rate. His poverty rate is the third highest as well. However, he also has the lowest inflation rate — the only president on this list with no (0.0%) inflation.
Check Out: How Much Is Sen. Mitch McConnell Worth?
Barack Obama (2009-2017)
GDP growth: 1.0%
Unemployment rate: 4.7%
Inflation rate: 2.5%
Poverty rate: 14.00%
Real disposable income per capita: $42,914
Disposable income per capita (adjusted for inflation): $48,811
Barack Obama had the difficult task of taking over on the tail end of the Great Recession, and that may explain some of his numbers. For instance, GDP growth was the fourth lowest under him (though much better than his predecessor). The poverty rate was also the second highest under Obama. To his credit, though, he has the fourth-lowest unemployment rate — a stark contrast from Bush. Inflation was also low during his years in office.

Donald Trump (2017-2021)
GDP growth: 2.6%
Unemployment rate: 6.4%
Inflation rate: 1.4%
Poverty rate: 11.90%
Real disposable income per capita: $48,286
Disposable income per capita (adjusted for inflation): $48,286
When looking at the numbers, Donald Trump is mostly better than average. Inflation was just 1.4% during his years, which is the second lowest. The poverty rate during his years also ties him with Ford for the second lowest on this list. GDP growth was also fourth highest for him. At over 6% though, unemployment was on the high end for him, putting him fifth highest in that category.
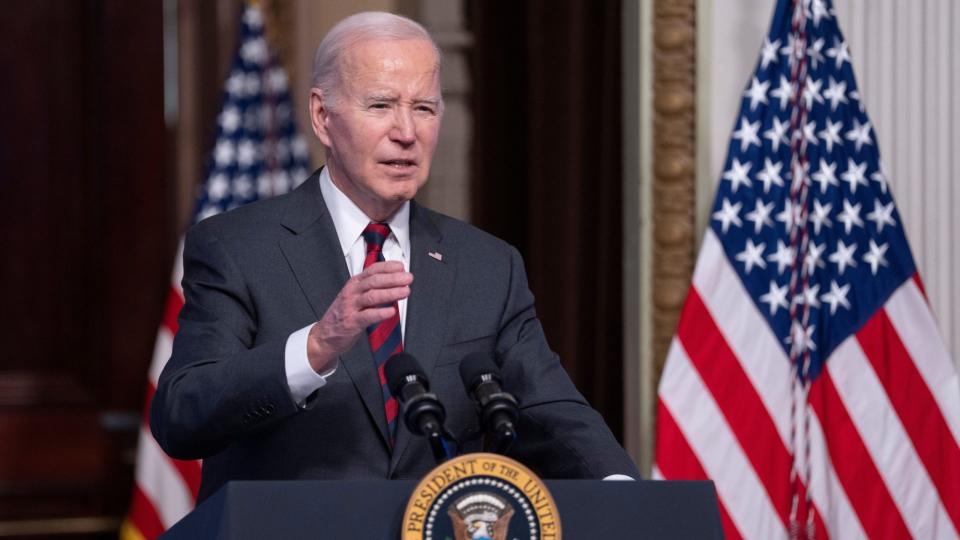
Joe Biden (2021-Present)
GDP growth: 2.6%
Unemployment rate: 3.5%
Inflation rate: 5.0%
Poverty rate: 12.80%
Real disposable income per capita: $46,682
Disposable income per capita (adjusted for inflation): $46,557
As of this writing, Biden has been in office for a little over two years, so it’s still difficult to compare him to other presidents who completed a term or two. Nevertheless, the unemployment rate for Biden is the second lowest on this list, and GDP growth is the second highest. He is in the middle of the pack for poverty and inflation.
More From GOBankingRates
I Earn Over $30K a Week in Semi-Passive Income on Amazon - Here's How
This is One of the Best Ways to Boost Your Retirement Savings in 2024
Here's How to Add $200 to Your Wallet -- Just For Banking Like You Normally Would
This article originally appeared on GOBankingRates.com: From LBJ to Biden: How the Economy Performed Under Each President
