How Financially Strong Is EnerSys (NYSE:ENS)?

Want to participate in a short research study? Help shape the future of investing tools and you could win a $250 gift card!
While small-cap stocks, such as EnerSys (NYSE:ENS) with its market cap of US$2.9b, are popular for their explosive growth, investors should also be aware of their balance sheet to judge whether the company can survive a downturn. Understanding the company's financial health becomes essential, since poor capital management may bring about bankruptcies, which occur at a higher rate for small-caps. The following basic checks can help you get a picture of the company's balance sheet strength. However, these checks don't give you a full picture, so I recommend you dig deeper yourself into ENS here.
Does ENS Produce Much Cash Relative To Its Debt?
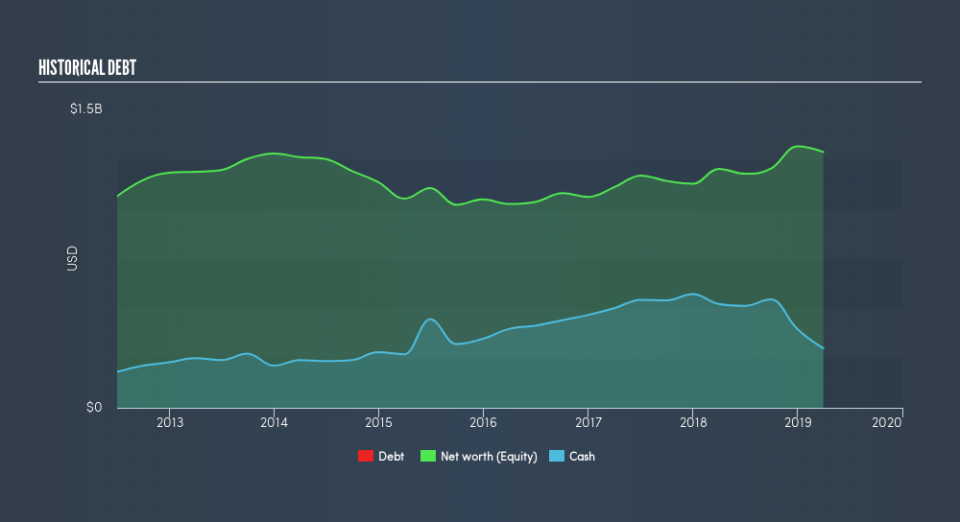
ENS has built up its total debt levels in the last twelve months, from US$598m to US$1.0b – this includes long-term debt. With this growth in debt, ENS currently has US$299m remaining in cash and short-term investments , ready to be used for running the business. On top of this, ENS has generated cash from operations of US$198m during the same period of time, resulting in an operating cash to total debt ratio of 19%, signalling that ENS’s current level of operating cash is not high enough to cover debt.
Can ENS pay its short-term liabilities?
At the current liabilities level of US$613m, the company has been able to meet these commitments with a current assets level of US$1.5b, leading to a 2.51x current account ratio. The current ratio is the number you get when you divide current assets by current liabilities. Generally, for Electrical companies, this is a reasonable ratio since there is a bit of a cash buffer without leaving too much capital in a low-return environment.
Can ENS service its debt comfortably?
ENS is a relatively highly levered company with a debt-to-equity of 81%. This is somewhat unusual for small-caps companies, since lenders are often hesitant to provide attractive interest rates to less-established businesses. We can check to see whether ENS is able to meet its debt obligations by looking at the net interest coverage ratio. A company generating earnings before interest and tax (EBIT) at least three times its net interest payments is considered financially sound. In ENS's, case, the ratio of 8.86x suggests that interest is appropriately covered, which means that debtors may be willing to loan the company more money, giving ENS ample headroom to grow its debt facilities.
Next Steps:
Although ENS’s debt level is towards the higher end of the spectrum, its cash flow coverage seems adequate to meet obligations which means its debt is being efficiently utilised. This may mean this is an optimal capital structure for the business, given that it is also meeting its short-term commitment. I admit this is a fairly basic analysis for ENS's financial health. Other important fundamentals need to be considered alongside. You should continue to research EnerSys to get a more holistic view of the small-cap by looking at:
Future Outlook: What are well-informed industry analysts predicting for ENS’s future growth? Take a look at our free research report of analyst consensus for ENS’s outlook.
Valuation: What is ENS worth today? Is the stock undervalued, even when its growth outlook is factored into its intrinsic value? The intrinsic value infographic in our free research report helps visualize whether ENS is currently mispriced by the market.
Other High-Performing Stocks: Are there other stocks that provide better prospects with proven track records? Explore our free list of these great stocks here.
We aim to bring you long-term focused research analysis driven by fundamental data. Note that our analysis may not factor in the latest price-sensitive company announcements or qualitative material.
If you spot an error that warrants correction, please contact the editor at editorial-team@simplywallst.com. This article by Simply Wall St is general in nature. It does not constitute a recommendation to buy or sell any stock, and does not take account of your objectives, or your financial situation. Simply Wall St has no position in the stocks mentioned. Thank you for reading.
