How Financially Strong Is Ever-Glory International Group, Inc. (NASDAQ:EVK)?

While small-cap stocks, such as Ever-Glory International Group, Inc. (NASDAQ:EVK) with its market cap of US$52m, are popular for their explosive growth, investors should also be aware of their balance sheet to judge whether the company can survive a downturn. Evaluating financial health as part of your investment thesis is crucial, since poor capital management may bring about bankruptcies, which occur at a higher rate for small-caps. Let's work through some financial health checks you may wish to consider if you're interested in this stock. However, this is just a partial view of the stock, and I’d encourage you to dig deeper yourself into EVK here.
Want to participate in a short research study? Help shape the future of investing tools and you could win a $250 gift card!
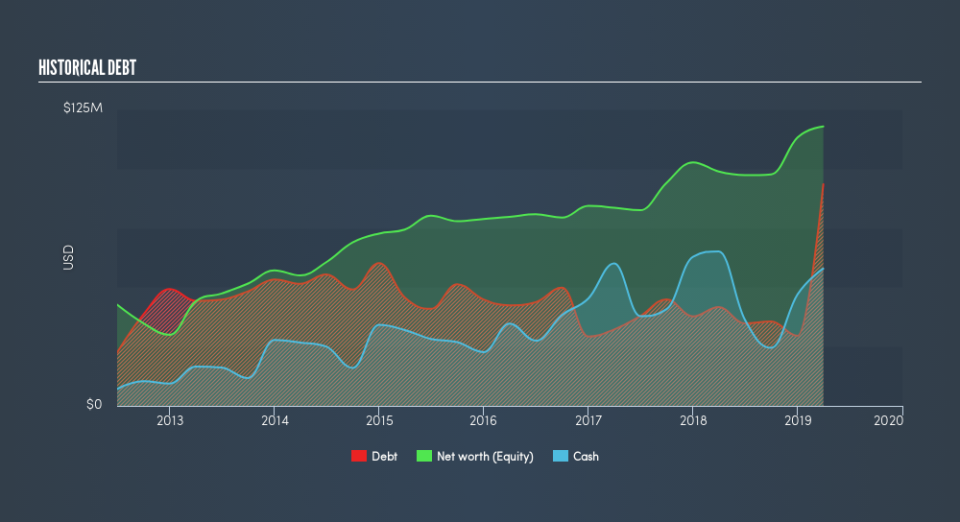
EVK’s Debt (And Cash Flows)
Over the past year, EVK has ramped up its debt from US$42m to US$93m , which includes long-term debt. With this growth in debt, EVK currently has US$58m remaining in cash and short-term investments , ready to be used for running the business. On top of this, EVK has generated US$5.9m in operating cash flow in the last twelve months, leading to an operating cash to total debt ratio of 6.3%, signalling that EVK’s current level of operating cash is not high enough to cover debt.
Can EVK meet its short-term obligations with the cash in hand?
With current liabilities at US$156m, it appears that the company has been able to meet these obligations given the level of current assets of US$184m, with a current ratio of 1.18x. The current ratio is the number you get when you divide current assets by current liabilities. For Luxury companies, this ratio is within a sensible range as there's enough of a cash buffer without holding too much capital in low return investments.
Can EVK service its debt comfortably?
EVK is a relatively highly levered company with a debt-to-equity of 79%. This is somewhat unusual for small-caps companies, since lenders are often hesitant to provide attractive interest rates to less-established businesses. We can test if EVK’s debt levels are sustainable by measuring interest payments against earnings of a company. Ideally, earnings before interest and tax (EBIT) should cover net interest by at least three times. For EVK, the ratio of 29.1x suggests that interest is comfortably covered, which means that lenders may be willing to lend out more funding as EVK’s high interest coverage is seen as responsible and safe practice.
Next Steps:
EVK’s high cash coverage means that, although its debt levels are high, the company is able to utilise its borrowings efficiently in order to generate cash flow. Since there is also no concerns around EVK's liquidity needs, this may be its optimal capital structure for the time being. I admit this is a fairly basic analysis for EVK's financial health. Other important fundamentals need to be considered alongside. I suggest you continue to research Ever-Glory International Group to get a more holistic view of the small-cap by looking at:
Future Outlook: What are well-informed industry analysts predicting for EVK’s future growth? Take a look at our free research report of analyst consensus for EVK’s outlook.
Historical Performance: What has EVK's returns been like over the past? Go into more detail in the past track record analysis and take a look at the free visual representations of our analysis for more clarity.
Other High-Performing Stocks: Are there other stocks that provide better prospects with proven track records? Explore our free list of these great stocks here.
We aim to bring you long-term focused research analysis driven by fundamental data. Note that our analysis may not factor in the latest price-sensitive company announcements or qualitative material.
If you spot an error that warrants correction, please contact the editor at editorial-team@simplywallst.com. This article by Simply Wall St is general in nature. It does not constitute a recommendation to buy or sell any stock, and does not take account of your objectives, or your financial situation. Simply Wall St has no position in the stocks mentioned. Thank you for reading.
