How Financially Strong Is Ferguson plc (LON:FERG)?

Want to participate in a short research study? Help shape the future of investing tools and you could win a $250 gift card!
Investors seeking to preserve capital in a volatile environment might consider large-cap stocks such as Ferguson plc (LON:FERG) a safer option. Market participants who are conscious of risk tend to search for large firms, attracted by the prospect of varied revenue sources and strong returns on capital. But, the key to their continued success lies in its financial health. Let’s take a look at Ferguson’s leverage and assess its financial strength to get an idea of their ability to fund strategic acquisitions and grow through cyclical pressures. Note that this commentary is very high-level and solely focused on financial health, so I suggest you dig deeper yourself into FERG here.
Check out our latest analysis for Ferguson
FERG’s Debt (And Cash Flows)
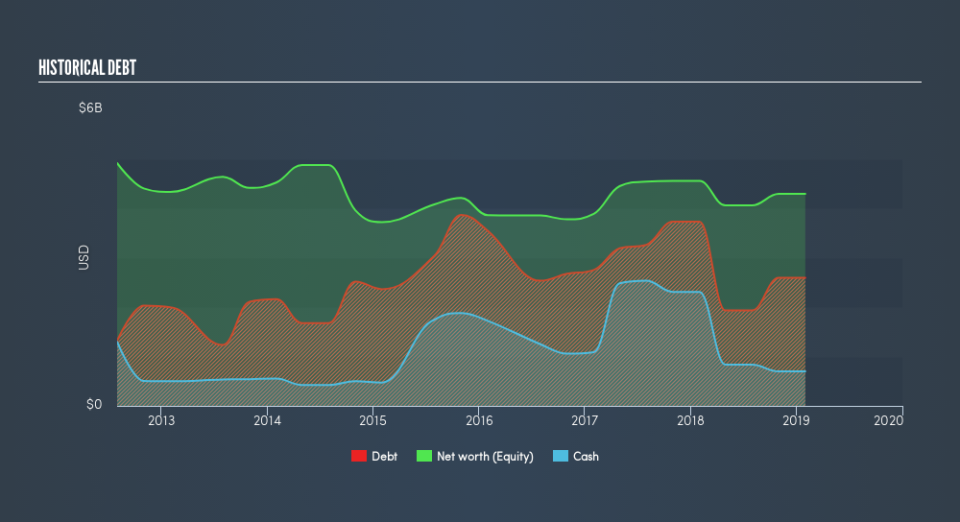
Over the past year, FERG has reduced its debt from US$3.7b to US$2.6b – this includes long-term debt. With this debt payback, FERG's cash and short-term investments stands at US$699m to keep the business going. On top of this, FERG has generated cash from operations of US$896m in the last twelve months, leading to an operating cash to total debt ratio of 35%, indicating that FERG’s current level of operating cash is high enough to cover debt.
Can FERG pay its short-term liabilities?
Looking at FERG’s US$3.6b in current liabilities, it appears that the company has maintained a safe level of current assets to meet its obligations, with the current ratio last standing at 1.84x. The current ratio is calculated by dividing current assets by current liabilities. Generally, for Trade Distributors companies, this is a reasonable ratio since there's a sufficient cash cushion without leaving too much capital idle or in low-earning investments.
Does FERG face the risk of succumbing to its debt-load?
With debt reaching 60% of equity, FERG may be thought of as relatively highly levered. This isn’t surprising for large-caps, as equity can often be more expensive to issue than debt, plus interest payments are tax deductible. Accordingly, large companies often have lower cost of capital due to easily obtained financing, providing an advantage over smaller companies. We can check to see whether FERG is able to meet its debt obligations by looking at the net interest coverage ratio. Ideally, earnings before interest and tax (EBIT) should cover net interest by at least three times. In FERG's case, the ratio of 23.95x suggests that interest is comfortably covered. It is considered a responsible and reassuring practice to maintain high interest coverage, which makes FERG and other large-cap investments thought to be safe.
Next Steps:
Although FERG’s debt level is towards the higher end of the spectrum, its cash flow coverage seems adequate to meet obligations which means its debt is being efficiently utilised. Since there is also no concerns around FERG's liquidity needs, this may be its optimal capital structure for the time being. I admit this is a fairly basic analysis for FERG's financial health. Other important fundamentals need to be considered alongside. I recommend you continue to research Ferguson to get a more holistic view of the large-cap by looking at:
Future Outlook: What are well-informed industry analysts predicting for FERG’s future growth? Take a look at our free research report of analyst consensus for FERG’s outlook.
Valuation: What is FERG worth today? Is the stock undervalued, even when its growth outlook is factored into its intrinsic value? The intrinsic value infographic in our free research report helps visualize whether FERG is currently mispriced by the market.
Other High-Performing Stocks: Are there other stocks that provide better prospects with proven track records? Explore our free list of these great stocks here.
We aim to bring you long-term focused research analysis driven by fundamental data. Note that our analysis may not factor in the latest price-sensitive company announcements or qualitative material.
If you spot an error that warrants correction, please contact the editor at editorial-team@simplywallst.com. This article by Simply Wall St is general in nature. It does not constitute a recommendation to buy or sell any stock, and does not take account of your objectives, or your financial situation. Simply Wall St has no position in the stocks mentioned. Thank you for reading.
