How Financially Strong Is Fosun International Limited (HKG:656)?

Want to participate in a short research study? Help shape the future of investing tools and you could win a $250 gift card!
Investors pursuing a solid, dependable stock investment can often be led to Fosun International Limited (HKG:656), a large-cap worth HK$91b. Doing business globally, large caps tend to have diversified revenue streams and attractive capital returns, making them desirable investments for risk-averse portfolios. But, its financial health remains the key to continued success. Today we will look at Fosun International’s financial liquidity and debt levels, which are strong indicators for whether the company can weather economic downturns or fund strategic acquisitions for future growth. Note that this commentary is very high-level and solely focused on financial health, so I suggest you dig deeper yourself into 656 here.
View our latest analysis for Fosun International
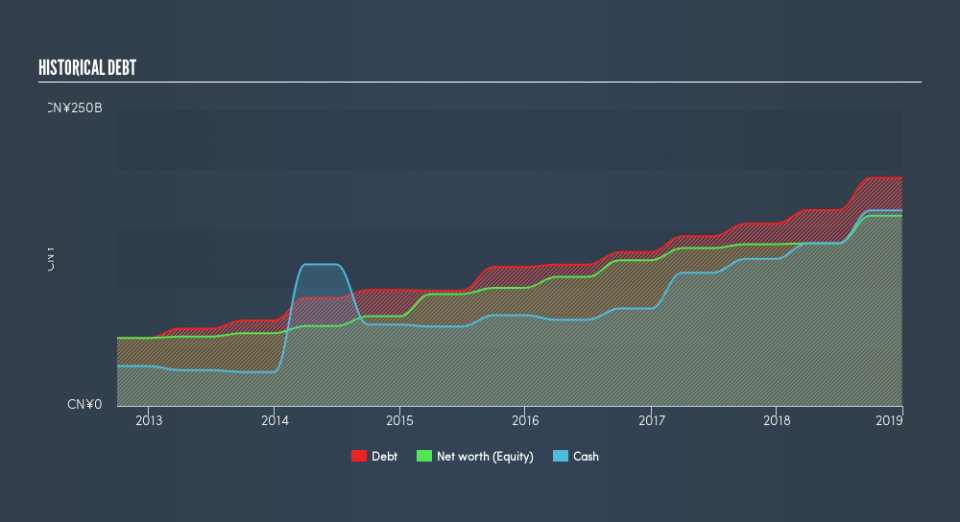
656’s Debt (And Cash Flows)
656 has built up its total debt levels in the last twelve months, from CN¥154b to CN¥193b , which accounts for long term debt. With this increase in debt, the current cash and short-term investment levels stands at CN¥165b to keep the business going. On top of this, 656 has produced CN¥13b in operating cash flow over the same time period, leading to an operating cash to total debt ratio of 6.9%, indicating that 656’s operating cash is less than its debt.
Can 656 meet its short-term obligations with the cash in hand?
With current liabilities at CN¥234b, the company has been able to meet these commitments with a current assets level of CN¥277b, leading to a 1.19x current account ratio. The current ratio is calculated by dividing current assets by current liabilities. Usually, for Industrials companies, this is a suitable ratio as there's enough of a cash buffer without holding too much capital in low return investments.
Does 656 face the risk of succumbing to its debt-load?
Since equity is smaller than total debt levels, Fosun International is considered to have high leverage. This isn’t uncommon for large companies because interest payments on debt are tax deductible, meaning debt can be a cheaper source of capital than equity. Since large-caps are seen as safer than their smaller constituents, they tend to enjoy lower cost of capital. We can test if 656’s debt levels are sustainable by measuring interest payments against earnings of a company. As a rule of thumb, a company should have earnings before interest and tax (EBIT) of at least three times the size of net interest. In 656's case, the ratio of 0.35x suggests that interest is not strongly covered. Although it is highly unlikely we'd see Fosun International defaulting or announcing bankruptcy tomorrow, this situation may put the company in a tough position when borrowing more money in the future to fuel its growth.
Next Steps:
656’s debt and cash flow levels indicate room for improvement. Its cash flow coverage of less than a quarter of debt means that operating efficiency could be an issue. However, the company exhibits an ability to meet its near-term obligations, which isn't a big surprise for a large-cap. This is only a rough assessment of financial health, and I'm sure 656 has company-specific issues impacting its capital structure decisions. I recommend you continue to research Fosun International to get a more holistic view of the stock by looking at:
Future Outlook: What are well-informed industry analysts predicting for 656’s future growth? Take a look at our free research report of analyst consensus for 656’s outlook.
Valuation: What is 656 worth today? Is the stock undervalued, even when its growth outlook is factored into its intrinsic value? The intrinsic value infographic in our free research report helps visualize whether 656 is currently mispriced by the market.
Other High-Performing Stocks: Are there other stocks that provide better prospects with proven track records? Explore our free list of these great stocks here.
We aim to bring you long-term focused research analysis driven by fundamental data. Note that our analysis may not factor in the latest price-sensitive company announcements or qualitative material.
If you spot an error that warrants correction, please contact the editor at editorial-team@simplywallst.com. This article by Simply Wall St is general in nature. It does not constitute a recommendation to buy or sell any stock, and does not take account of your objectives, or your financial situation. Simply Wall St has no position in the stocks mentioned. Thank you for reading.

