How Financially Strong Is Genesis Energy Limited (NZSE:GNE)?

Want to participate in a research study? Help shape the future of investing tools and earn a $60 gift card!
Mid-caps stocks, like Genesis Energy Limited (NZSE:GNE) with a market capitalization of NZ$3.3b, aren’t the focus of most investors who prefer to direct their investments towards either large-cap or small-cap stocks. However, generally ignored mid-caps have historically delivered better risk adjusted returns than both of those groups. This article will examine GNE’s financial liquidity and debt levels to get an idea of whether the company can deal with cyclical downturns and maintain funds to accommodate strategic spending for future growth. Remember this is a very top-level look that focuses exclusively on financial health, so I recommend a deeper analysis into GNE here.
View our latest analysis for Genesis Energy
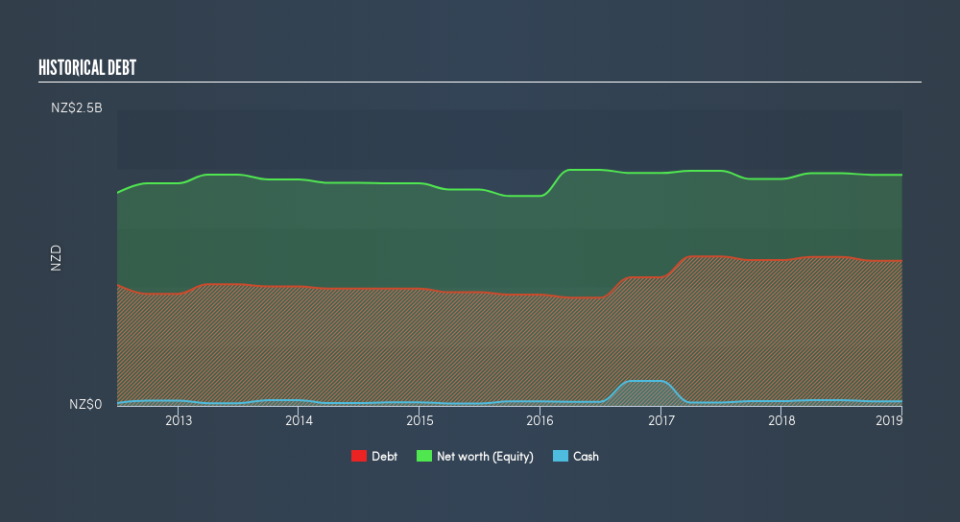
GNE’s Debt (And Cash Flows)
GNE's debt level has been constant at around NZ$1.2b over the previous year which accounts for long term debt. At this constant level of debt, GNE currently has NZ$38m remaining in cash and short-term investments , ready to be used for running the business. On top of this, GNE has produced NZ$303m in operating cash flow in the last twelve months, resulting in an operating cash to total debt ratio of 25%, meaning that GNE’s debt is appropriately covered by operating cash.
Can GNE meet its short-term obligations with the cash in hand?
At the current liabilities level of NZ$340m, the company has been able to meet these obligations given the level of current assets of NZ$380m, with a current ratio of 1.12x. The current ratio is calculated by dividing current assets by current liabilities. Usually, for Electric Utilities companies, this is a suitable ratio as there's enough of a cash buffer without holding too much capital in low return investments.
Can GNE service its debt comfortably?
With debt reaching 63% of equity, GNE may be thought of as relatively highly levered. This is not unusual for mid-caps as debt tends to be a cheaper and faster source of funding for some businesses. No matter how high the company’s debt, if it can easily cover the interest payments, it’s considered to be efficient with its use of excess leverage. A company generating earnings after interest and tax at least three times its net interest payments is considered financially sound. In GNE's case, the ratio of 2.48x suggests that interest is not strongly covered, which means that debtors may be less inclined to loan the company more money, reducing its headroom for growth through debt.
Next Steps:
GNE’s high cash coverage means that, although its debt levels are high, the company is able to utilise its borrowings efficiently in order to generate cash flow. Since there is also no concerns around GNE's liquidity needs, this may be its optimal capital structure for the time being. Keep in mind I haven't considered other factors such as how GNE has been performing in the past. I recommend you continue to research Genesis Energy to get a better picture of the mid-cap by looking at:
Future Outlook: What are well-informed industry analysts predicting for GNE’s future growth? Take a look at our free research report of analyst consensus for GNE’s outlook.
Valuation: What is GNE worth today? Is the stock undervalued, even when its growth outlook is factored into its intrinsic value? The intrinsic value infographic in our free research report helps visualize whether GNE is currently mispriced by the market.
Other High-Performing Stocks: Are there other stocks that provide better prospects with proven track records? Explore our free list of these great stocks here.
We aim to bring you long-term focused research analysis driven by fundamental data. Note that our analysis may not factor in the latest price-sensitive company announcements or qualitative material.
If you spot an error that warrants correction, please contact the editor at editorial-team@simplywallst.com. This article by Simply Wall St is general in nature. It does not constitute a recommendation to buy or sell any stock, and does not take account of your objectives, or your financial situation. Simply Wall St has no position in the stocks mentioned. Thank you for reading.
