Do Its Financials Have Any Role To Play In Driving Gale Pacific Limited's (ASX:GAP) Stock Up Recently?
Gale Pacific (ASX:GAP) has had a great run on the share market with its stock up by a significant 13% over the last three months. As most would know, fundamentals are what usually guide market price movements over the long-term, so we decided to look at the company's key financial indicators today to determine if they have any role to play in the recent price movement. In this article, we decided to focus on Gale Pacific's ROE.
Return on equity or ROE is an important factor to be considered by a shareholder because it tells them how effectively their capital is being reinvested. In other words, it is a profitability ratio which measures the rate of return on the capital provided by the company's shareholders.
View our latest analysis for Gale Pacific
How To Calculate Return On Equity?
ROE can be calculated by using the formula:
Return on Equity = Net Profit (from continuing operations) ÷ Shareholders' Equity
So, based on the above formula, the ROE for Gale Pacific is:
14% = AU$12m ÷ AU$88m (Based on the trailing twelve months to December 2020).
The 'return' is the profit over the last twelve months. One way to conceptualize this is that for each A$1 of shareholders' capital it has, the company made A$0.14 in profit.
What Has ROE Got To Do With Earnings Growth?
So far, we've learned that ROE is a measure of a company's profitability. We now need to evaluate how much profit the company reinvests or "retains" for future growth which then gives us an idea about the growth potential of the company. Generally speaking, other things being equal, firms with a high return on equity and profit retention, have a higher growth rate than firms that don’t share these attributes.
Gale Pacific's Earnings Growth And 14% ROE
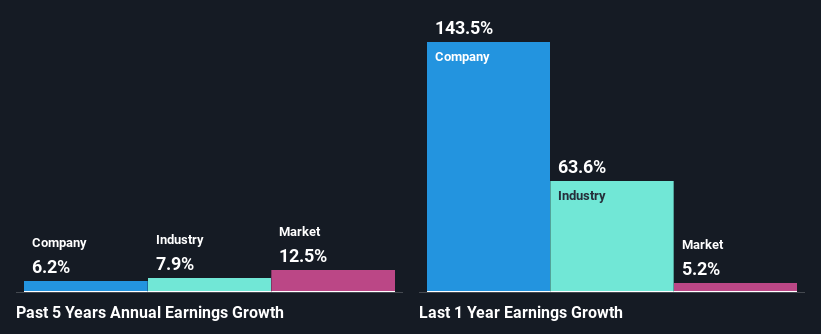
To start with, Gale Pacific's ROE looks acceptable. Even so, when compared with the average industry ROE of 21%, we aren't very excited. Gale Pacific was still able to see a decent net income growth of 6.2% over the past five years. So, there might be other aspects that are positively influencing earnings growth. For example, it is possible that the company's management has made some good strategic decisions, or that the company has a low payout ratio. Bear in mind, the company does have a respectable level of ROE. It is just that the industry ROE is higher. So this also provides some context to the earnings growth seen by the company.
Next, on comparing with the industry net income growth, we found that Gale Pacific's reported growth was lower than the industry growth of 7.9% in the same period, which is not something we like to see.
The basis for attaching value to a company is, to a great extent, tied to its earnings growth. The investor should try to establish if the expected growth or decline in earnings, whichever the case may be, is priced in. By doing so, they will have an idea if the stock is headed into clear blue waters or if swampy waters await. If you're wondering about Gale Pacific's's valuation, check out this gauge of its price-to-earnings ratio, as compared to its industry.
Is Gale Pacific Efficiently Re-investing Its Profits?
While Gale Pacific has a three-year median payout ratio of 60% (which means it retains 40% of profits), the company has still seen a fair bit of earnings growth in the past, meaning that its high payout ratio hasn't hampered its ability to grow.
Additionally, Gale Pacific has paid dividends over a period of at least ten years which means that the company is pretty serious about sharing its profits with shareholders.
Conclusion
Overall, we feel that Gale Pacific certainly does have some positive factors to consider. Its earnings have grown respectably as we saw earlier, which was likely achieved by the company reinvesting its earnings at a decent rate of return. Still, its earnings retention is quite low, so we wonder if the company's growth could be higher, were it to pay out less dividends and retain more of its profits? Up till now, we've only made a short study of the company's growth data. You can do your own research on Gale Pacific and see how it has performed in the past by looking at this FREE detailed graph of past earnings, revenue and cash flows.
This article by Simply Wall St is general in nature. It does not constitute a recommendation to buy or sell any stock, and does not take account of your objectives, or your financial situation. We aim to bring you long-term focused analysis driven by fundamental data. Note that our analysis may not factor in the latest price-sensitive company announcements or qualitative material. Simply Wall St has no position in any stocks mentioned.
Have feedback on this article? Concerned about the content? Get in touch with us directly. Alternatively, email editorial-team (at) simplywallst.com.

