How Do Fintel Energia Group S.p.A.’s (BIT:FTL) Returns On Capital Compare To Peers?

Want to participate in a short research study? Help shape the future of investing tools and you could win a $250 gift card!
Today we'll evaluate Fintel Energia Group S.p.A. (BIT:FTL) to determine whether it could have potential as an investment idea. Specifically, we'll consider its Return On Capital Employed (ROCE), since that will give us an insight into how efficiently the business can generate profits from the capital it requires.
First up, we'll look at what ROCE is and how we calculate it. Next, we'll compare it to others in its industry. Last but not least, we'll look at what impact its current liabilities have on its ROCE.
What is Return On Capital Employed (ROCE)?
ROCE is a measure of a company's yearly pre-tax profit (its return), relative to the capital employed in the business. In general, businesses with a higher ROCE are usually better quality. Ultimately, it is a useful but imperfect metric. Author Edwin Whiting says to be careful when comparing the ROCE of different businesses, since 'No two businesses are exactly alike.'
So, How Do We Calculate ROCE?
The formula for calculating the return on capital employed is:
Return on Capital Employed = Earnings Before Interest and Tax (EBIT) ÷ (Total Assets - Current Liabilities)
Or for Fintel Energia Group:
0.018 = €2.0m ÷ (€147m - €36m) (Based on the trailing twelve months to December 2018.)
So, Fintel Energia Group has an ROCE of 1.9%.
Check out our latest analysis for Fintel Energia Group
Does Fintel Energia Group Have A Good ROCE?
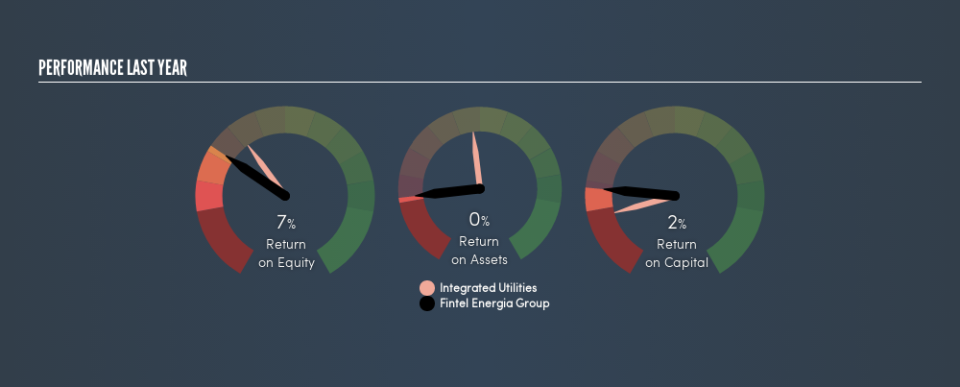
One way to assess ROCE is to compare similar companies. In this analysis, Fintel Energia Group's ROCE appears meaningfully below the 6.5% average reported by the Integrated Utilities industry. This could be seen as a negative, as it suggests some competitors may be employing their capital more efficiently. Independently of how Fintel Energia Group compares to its industry, its ROCE in absolute terms is low; especially compared to the ~2.9% available in government bonds. Readers may wish to look for more rewarding investments.
Fintel Energia Group has an ROCE of 1.9%, but it didn't have an ROCE 3 years ago, since it was unprofitable. That suggests the business has returned to profitability. You can click on the image below to see (in greater detail) how Fintel Energia Group's past growth compares to other companies.
Remember that this metric is backwards looking - it shows what has happened in the past, and does not accurately predict the future. ROCE can be misleading for companies in cyclical industries, with returns looking impressive during the boom times, but very weak during the busts. ROCE is only a point-in-time measure. How cyclical is Fintel Energia Group? You can see for yourself by looking at this free graph of past earnings, revenue and cash flow.
Do Fintel Energia Group's Current Liabilities Skew Its ROCE?
Liabilities, such as supplier bills and bank overdrafts, are referred to as current liabilities if they need to be paid within 12 months. Due to the way ROCE is calculated, a high level of current liabilities makes a company look as though it has less capital employed, and thus can (sometimes unfairly) boost the ROCE. To check the impact of this, we calculate if a company has high current liabilities relative to its total assets.
Fintel Energia Group has total assets of €147m and current liabilities of €36m. Therefore its current liabilities are equivalent to approximately 25% of its total assets. This is not a high level of current liabilities, which would not boost the ROCE by much.
What We Can Learn From Fintel Energia Group's ROCE
That's not a bad thing, however Fintel Energia Group has a weak ROCE and may not be an attractive investment. But note: make sure you look for a great company, not just the first idea you come across. So take a peek at this free list of interesting companies with strong recent earnings growth (and a P/E ratio below 20).
If you are like me, then you will not want to miss this free list of growing companies that insiders are buying.
We aim to bring you long-term focused research analysis driven by fundamental data. Note that our analysis may not factor in the latest price-sensitive company announcements or qualitative material.
If you spot an error that warrants correction, please contact the editor at editorial-team@simplywallst.com. This article by Simply Wall St is general in nature. It does not constitute a recommendation to buy or sell any stock, and does not take account of your objectives, or your financial situation. Simply Wall St has no position in the stocks mentioned. Thank you for reading.

