Do You Like First BanCorp. (NYSE:FBP) At This P/E Ratio?

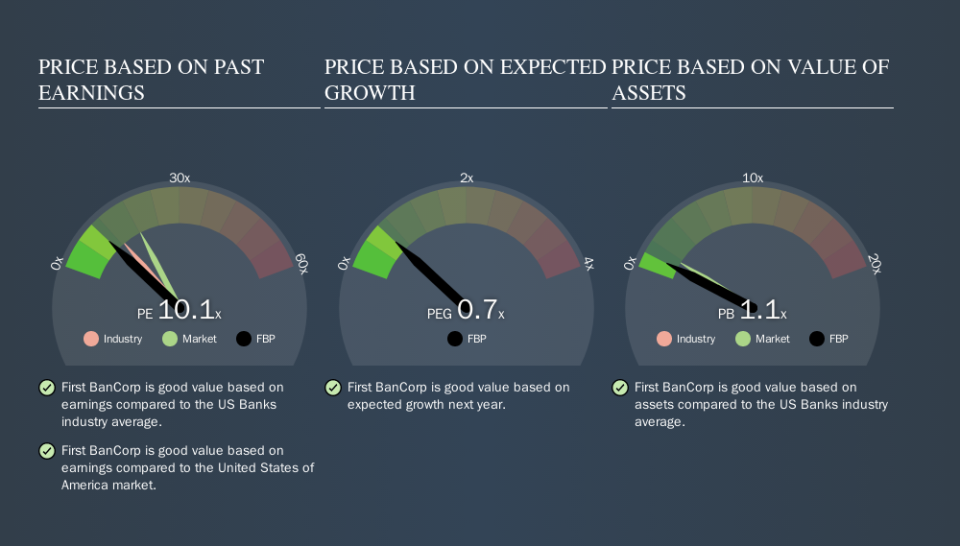
This article is for investors who would like to improve their understanding of price to earnings ratios (P/E ratios). We'll look at First BanCorp.'s (NYSE:FBP) P/E ratio and reflect on what it tells us about the company's share price. First BanCorp has a P/E ratio of 10.10, based on the last twelve months. That means that at current prices, buyers pay $10.10 for every $1 in trailing yearly profits.
See our latest analysis for First BanCorp
How Do I Calculate A Price To Earnings Ratio?
The formula for P/E is:
Price to Earnings Ratio = Price per Share ÷ Earnings per Share (EPS)
Or for First BanCorp:
P/E of 10.10 = $10.70 ÷ $1.06 (Based on the year to September 2019.)
Is A High Price-to-Earnings Ratio Good?
The higher the P/E ratio, the higher the price tag of a business, relative to its trailing earnings. That is not a good or a bad thing per se, but a high P/E does imply buyers are optimistic about the future.
Does First BanCorp Have A Relatively High Or Low P/E For Its Industry?
The P/E ratio indicates whether the market has higher or lower expectations of a company. The image below shows that First BanCorp has a lower P/E than the average (12.7) P/E for companies in the banks industry.
Its relatively low P/E ratio indicates that First BanCorp shareholders think it will struggle to do as well as other companies in its industry classification. Many investors like to buy stocks when the market is pessimistic about their prospects. You should delve deeper. I like to check if company insiders have been buying or selling.
How Growth Rates Impact P/E Ratios
Probably the most important factor in determining what P/E a company trades on is the earnings growth. That's because companies that grow earnings per share quickly will rapidly increase the 'E' in the equation. That means unless the share price increases, the P/E will reduce in a few years. Then, a lower P/E should attract more buyers, pushing the share price up.
First BanCorp's 87% EPS improvement over the last year was like bamboo growth after rain; rapid and impressive. The cherry on top is that the five year growth rate was an impressive 23% per year. With that kind of growth rate we would generally expect a high P/E ratio.
Remember: P/E Ratios Don't Consider The Balance Sheet
It's important to note that the P/E ratio considers the market capitalization, not the enterprise value. That means it doesn't take debt or cash into account. Theoretically, a business can improve its earnings (and produce a lower P/E in the future) by investing in growth. That means taking on debt (or spending its cash).
While growth expenditure doesn't always pay off, the point is that it is a good option to have; but one that the P/E ratio ignores.
So What Does First BanCorp's Balance Sheet Tell Us?
First BanCorp's net debt is 3.7% of its market cap. It would probably trade on a higher P/E ratio if it had a lot of cash, but I doubt it is having a big impact.
The Bottom Line On First BanCorp's P/E Ratio
First BanCorp's P/E is 10.1 which is below average (18.2) in the US market. The company hasn't stretched its balance sheet, and earnings growth was good last year. If the company can continue to grow earnings, then the current P/E may be unjustifiably low.
Investors should be looking to buy stocks that the market is wrong about. As value investor Benjamin Graham famously said, 'In the short run, the market is a voting machine but in the long run, it is a weighing machine. So this free visualization of the analyst consensus on future earnings could help you make the right decision about whether to buy, sell, or hold.
You might be able to find a better buy than First BanCorp. If you want a selection of possible winners, check out this free list of interesting companies that trade on a P/E below 20 (but have proven they can grow earnings).
We aim to bring you long-term focused research analysis driven by fundamental data. Note that our analysis may not factor in the latest price-sensitive company announcements or qualitative material.
If you spot an error that warrants correction, please contact the editor at editorial-team@simplywallst.com. This article by Simply Wall St is general in nature. It does not constitute a recommendation to buy or sell any stock, and does not take account of your objectives, or your financial situation. Simply Wall St has no position in the stocks mentioned. Thank you for reading.
